
We closed this position on May 17, 2022. A copy of the associated Position Update report is here.
Check out this week’s Danger Zone interview with Chuck Jaffe of Money Life and MarketWatch.com.
Last week we placed the entire Small Cap investment style in the Danger Zone and this week we’re focusing on a particular mutual fund within the style. Investment Managers Series Chartwell Small Cap Value Fund (CWSVX) is not only classified in the worst rated style, Small Cap Blend, it also happens to be the worst rated Small Cap Blend mutual fund. CWSVX, effectively the worst fund in the worst style, is in the Danger Zone this week for a number of reasons:
- Poor stock picking
- High total annual costs that are well above the style average
- A misleading “Small Cap Value” tagline
- Questionable top holdings
As a result of its poor portfolio and high costs, CWSVX earns our Very Dangerous rating. CWSVX is a perfect example of why investors need to look at each individual holding of a mutual fund before investing.
Bad Stock Picking Regardless of Style
We rate each of the ETFs and mutual funds under our coverage based on the quality of the stocks that they hold. CWSVX gets our Dangerous portfolio management rating because 62% of CWSVX’s holdings earn our Dangerous or Very Dangerous rating while only 5% are allocated to Attractive or Very Attractive stocks.
Eight of CWSVX’s top 10 holdings receive a Dangerous-or-worse rating, with two stocks on the Most Dangerous List in July.
The quality of CWSVX’s holdings, when compared to its benchmark, the iShares Russell 2000 ETF (IWM), doesn’t stack up very well either. IWM allocates more to Attractive-or-better rated stocks and less to Dangerous-or-worse rated stocks.
Figure 1: CWSVX Stacks Up Poorly to Its Benchmark
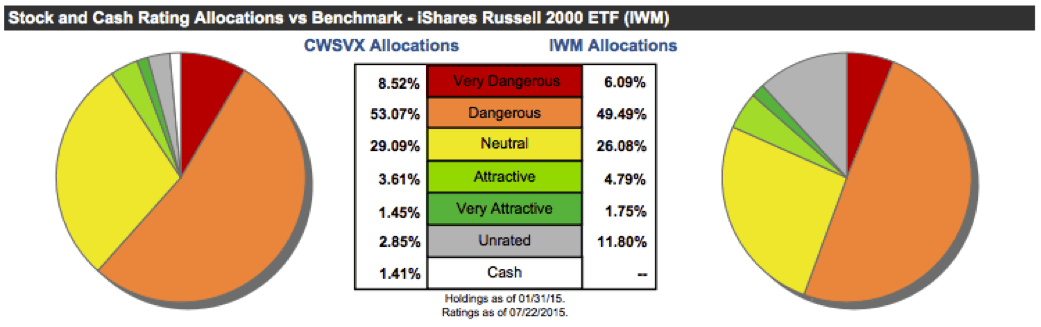
Sources: New Constructs, LLC and company filings.
Expense Ratio Doesn’t Tell the Whole Story
If CWSVX were a cheap fund, it might be easier to stomach poor portfolio management. But, with total annual costs of 5.22%, the fund is not cheap. For comparison, the average total annual cost for all style mutual funds is 1.9% and 2.2% for all Small Cap funds. IWM charges 0.22% per year.
To truly understand all the costs an investor incurs, you have to look beyond the expense ratio of 1.39% and capture the impact of CWSVX’s 5.75% front-end load and high annual turnover rate of 157%, which we estimate costs investors an additional 1.45% per year.
After taking into account all costs, CWSVX must outperform IWM by 4.99% annually over three years to justify its high total annual costs. In reality, CWSVX has not come close to this outperformance, which has left investors further in a hole. Over the past three years, IWM has delivered an 18% annualized return compared to only 15% for CWSVX.
Investors are paying higher fees for poor stock selection and, in turn, inferior performance.
What Proper Due Diligence Can Reveal
We question both the “small cap” and “value” descriptions for Chartwell Small Cap Value Fund.
Five of CWSVX’s top 10 holdings have market capitalizations that fall outside of the traditional Small Cap designation (<$2 billion market cap). If more of the portfolio is allocated to Mid Cap stocks, the fund will be assigned a new benchmark, which could have a major impact on fund flows and, consequently, on performance.
The “value” claim implies that the stocks being purchased are undervalued relative to their economic book value, or no growth value. However, CWSVX holds some of the most overvalued stocks in the market and is better classified as a Small Cap Blend fund.
Take for example, Lance Inc. (LNCE), which is one of CWSVX’s top holdings. Not only did Lance make our Most Dangerous List in July, but at its current price of $32/share, Lance has a price to economic book value (PEBV) ratio of 9.0. This ratio implies the market expects Lance to grow its after-tax profits (NOPAT) by 900%. Such high growth expectations don’t come across as very “value oriented” to us.
Overvaluation is not limited to just this one holding either. As a whole, CWSVX has an average PEBV ratio of 2.7, compared to 2.2 for the S&P 500. In addition, CWSVX has a growth appreciation period of 34 years compared to 20 years for the S&P 500. Essentially the market expects the stocks held by CWSVX to not only grow profits by a greater percentage, but also earn a return on invested capital (ROIC ) greater than WACC for 14 years longer than some of the largest and most established companies in today’s market. Once again, these high expectations do not befit a value designation in our book.
Investors Should Look Beyond CWSVX
Without analyzing each holding of CWSVX, investors fail to get a true picture of what they are buying. Investors would be better off forgoing an investment in CWSVX and taking a look at one of the 11 other Small Cap Blend ETFs and mutual funds that receive our Attractive-or-better rating.
Disclosure: David Trainer and Kyle Guske II receive no compensation to write about any specific stock, sector, style, or theme.
Click here to download a PDF of this report.
Photo Credit: Howard Lake (Flickr)