
For years, we’ve been ringing the alarm on dangerous ETFs and mutual funds that receive high ratings from legacy research providers, yet have poor holdings and expensive costs that offer investors poor risk/reward. As we’ll show below, heeding these warnings can save your portfolio. Those relying solely on backwards-looking fund research find themselves, once again, in the Danger Zone.
67% of Danger Zone Mutual Fund & ETF Picks Are Successful
Heeding our warnings on funds can save your portfolio. Of the 42 ETF and mutual funds we’ve put in the Danger Zone since our first Danger Zone report in August 2012, 28, or 67%, have underperformed[1] their benchmark and 37, or 88%, have underperformed the S&P 500, measured as State Street SPDR S&P 500 ETF (SPY).
Funds put in the Danger Zone have generated a cumulative 95% return since 2013. Meanwhile, the benchmark average return is 114% and SPY average return is 149%. When we put a fund or stock in the Danger Zone, woe to those who ignore our warnings.
Figure 1 shows this hypothetical growth of $10,000 scenario and how avoiding Danger Zone fund picks saved investors 19% in losses compared the benchmark average and 54% compared to the S&P 500.
Figure 1: Average Growth in $10,000 of Danger Zone Picks vs. Benchmarks: Through 5/13/22
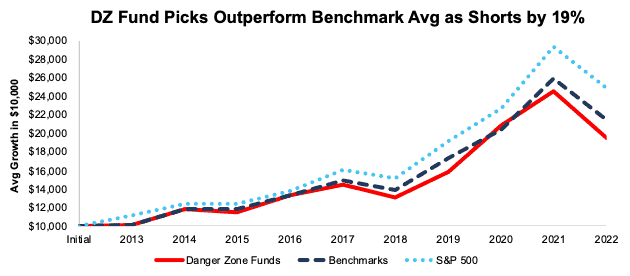
Sources: New Constructs, LLC and company filings.
Anyone focused on fulfilling the fiduciary duty of care recognizes that analyzing the holdings[2] of an ETF or mutual fund is critical to finding funds with attractive risk/reward. Our predictive mutual fund and ETF research is based on proven superior[3] fundamental, bottom-up research on each individual fund holding. This approach looks at the future risk/reward of a fund and differs from legacy fund research that’s backward-looking and based on past price performance.
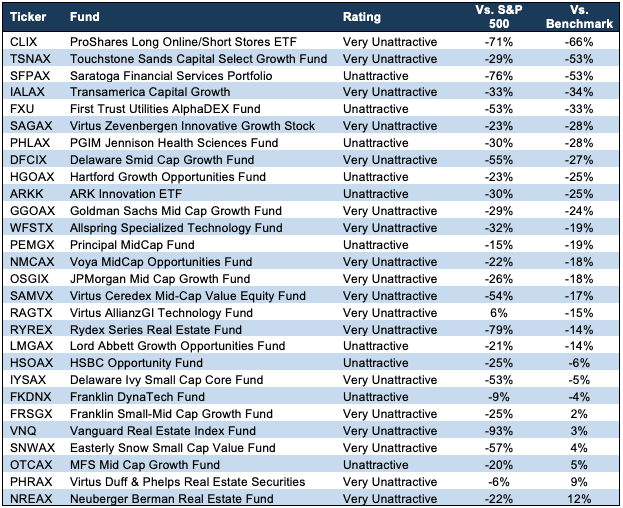
The five funds that have underperformed their respective benchmarks the most are ProShares Long Online/Short Stores ETF (CLIX), Touchstone Sands Capital Select Growth Fund (TSNAX), Saratoga Advantage Financial Services Portfolio (SFPAX), Transamerica Capital Growth Fund (IALAX) and First Trust Utilities AlphaDEX Fund (FXU).
In the case of CLIX, SFPAX, and FXU, the performance vs. the S&P 500 is even worse than performance vs. the benchmark. See Figure 2.
Figure 2: Danger Zone Funds That Underperformed the Benchmark The Most: Through 5/13/22
| Ticker | Fund | Vs. S&P 500 | Vs. Benchmark |
| CLIX | ProShares Long Online/Short Stores ETF | -71% | -66% |
| TSNAX | Touchstone Sands Capital Select Growth Fund | -29% | -53% |
| SFPAX | Saratoga Advantage Financial Services Portfolio | -76% | -53% |
| IALAX | Transamerica Capital Growth Fund | -33% | -34% |
| FXU | First Trust Utilities AlphaDEX Fund | -53% | -33% |
Sources: New Constructs, LLC and company filings.
Figure 2 excludes Rydex Energy Services Fund (RYESX) as the mutual fund is no longer in our coverage universe.
No Safety in 5-Star Ratings
Funds that receive a 5-Star rating from Morningstar are often thought to be best-in-class, despite longstanding evidence that a 5-Star rating doesn’t equate to outperformance (see the 5-star kiss of death). Three of the mutual funds we put in the Danger Zone[4] received a 5-star rating from Morningstar at the time our reports were published. All three underperformed the S&P 500 and two underperformed their benchmarks since report publication. The funds include Delaware Smid Cap Growth Fund (DFCIX), Principal Funds Mid Cap Fund (PEMGX), and MFS Mid Cap Growth Fund (OTCAX).
Figure 3: Performance of Danger Zone Funds That Had a 5-Star Morningstar Rating: Through 5/13/22
| Ticker | Fund | Vs. S&P 500 | Vs. Benchmark |
| DFCIX | Delaware Smid Cap Growth Fund | -55% | -27% |
| PEMGX | Principal Funds Mid Cap Fund | -15% | -19% |
| OTCAX | MFS Mid Cap Growth Fund | -20% | 5% |
Sources: New Constructs, LLC and company filings.
Delaware Smid Cap Growth Fund provides a perfect example of the drawbacks of backward-looking fund research compared to our predictive fund ratings. At the time of our report, which was published on February 1, 2021, DFCIX received a 5-Star rating from Morningstar. In the five years before our report, the fund was up 259% compared to a 150% rise in its benchmark, the iShares Russell Mid Cap Growth ETF (IWP).
However, our holdings analysis revealed that 71% of its portfolio was allocated to Unattractive-or-worse rated stocks. With such poor holdings, DFCIX earned our Very Unattractive rating and since our report is down 46% while IWP is down just 19%.
DFCIX now earns a 2-star Rating from Morningstar. The fund still earns our Very Unattractive rating given that 48% of its portfolio remains allocated to Unattractive-or-worse rated stocks and just 8% is allocated to Attractive-or-better rated stocks. Making matters worse, it charges investors total annual costs of 3.79% for this poor portfolio allocation. For reference, the benchmark, IWP, charges total annual costs of 0.25%.
We think PEMGX and OTCAX are likely to underperform moving forward, as both still receive our Unattractive rating despite a 4-Star rating from Morningstar.
These Funds Remain Unattractive
Figure 4 shows the funds we’ve previously put in the Danger Zone that still receive an Unattractive-or-worse fund rating. These funds still allocate to poorly rated stocks, charge investors too much to do so, or worse, both. Twenty-two, or 79%, of the Danger Zone fund picks that still earn an Unattractive-or-worse rating underperformed their benchmark and 27, or 96%, underperformed the S&P 500.
Six funds, listed below, receive a 4- or 5-star rating from Morningstar, while we rate them Unattractive or Very Unattractive. The six funds include:
- Neuberger Berman Real Estate Fund (NREAX) – 5 Stars
- JPMorgan Mid Cap Growth Fund (OSGIX) – 5 Stars
- Virtus Duff & Phelps Real Estate Securities Fund (PHRAX) – 4 Stars
- Principal Funds Mid Cap Fund (PEMGX) – 4 Stars
- MFS Mid Cap Growth Fund (OTCAX) – 4 Stars
- Delaware Ivy Small Cap Core Fund (IYSAX) – 4 Stars
Investors should avoid putting capital into these funds, as there are opportunities with better risk/reward elsewhere.
Figure 4: Open Danger Zone Fund Picks: Performance Through 5/13/22
Sources: New Constructs, LLC and company filings.
These Funds Are No Longer In the Danger Zone
Figure 5 shows the ETFs and mutual funds that no longer receive an Unattractive-or-worse rating (or are no longer in our coverage universe). The risk reward profile of these funds has changed since our original report, and we’re closing them as Danger Zone picks.
Six, or 43%, of these ETFs and mutual funds underperformed their benchmark and 11, or 79%, underperformed the S&P 500.
Figure 5: Fund Picks No Longer in the Danger Zone: Through 5/13/22
Sources: New Constructs, LLC and company filings.
How to Avoid “The Danger Within”
Why do you need to know the holdings of an ETF or mutual funds before you buy?
You need to be sure you do not buy a fund that might blow up. Buying a fund without analyzing its holdings is like buying a stock without analyzing its business and finances. No matter how cheap, if it holds bad stocks, the mutual fund’s performance will be bad. Don’t just take my word for it, see what Barron’s says on this matter.
PERFORMANCE OF FUND’S HOLDINGS – FEES = PERFORMANCE OF FUND
Analyzing each holding within funds is no small task. Our Robo-Analyst technology enables us to perform this diligence with scale and provide the research needed to fulfill the fiduciary duty of care. More of the biggest names in the financial industry (see At BlackRock, Machines Are Rising Over Managers to Pick Stocks) are now embracing technology to leverage machines in the investment research process. Technology may be the only solution to the dual mandate for research: cut costs and fulfill the fiduciary duty of care. Investors, clients, advisors and analysts deserve the latest in technology to get the diligence required to make prudent investment decisions.
Our Danger Zone picks are available in real-time to all Gold and higher members. Learn more here.
Check out this week’s Danger Zone interview with Chuck Jaffe of Money Life.
This article originally published on May 17, 2022.
Disclosure: David Trainer, Kyle Guske II, and Matt Shuler receive no compensation to write about any specific stock, sector, style, or theme.
Follow us on Twitter, Facebook, LinkedIn, and StockTwits for real-time alerts on all our research.
[1] Excluding Figure 1, performance of each individual ETF/MF, the S&P 500, and benchmark in this report is measured by growth in $10,000 as reported by Morningstar.
[2] See Harvard Business case New Constructs: Disrupting Fundamental Analysis with Robo-Analysts.
[3] Our research utilizes our Core Earnings, a more reliable measure of profits, as proven in Core Earnings: New Data & Evidence, written by professors at Harvard Business School & MIT Sloan and published in The Journal of Financial Economics.
[4] Only includes ETFs/mutual funds for which we have a Morningstar rating at the time of report publication. We do not have the Morningstar rating for 20 of the 42 Danger Zone fund picks.