
3Q22 GAAP earnings continued to drop from record highs reached in 1Q22 and remain lower than Core Earnings for the second consecutive quarter. Six of eleven sectors saw a quarter-over-quarter rise in Core Earnings through the trailing-twelve months (TTM) ended 3Q22, compared to seven in 2Q22.
This report is an abridged and free version of S&P 500 & Sectors: GAAP Earnings Continue to Fall in 3Q22, one of our quarterly series of reports on fundamental market and sector trends.
The full version of the report analyzes Core Earnings[1],[2] and GAAP earnings for the S&P 500 and each of its sectors (last quarter’s analysis is here). The full reports are available to those with our new Professional (previously known as Unlimited) and Institutional members or can be purchased below.
Generally Accepted Accounting Distortions
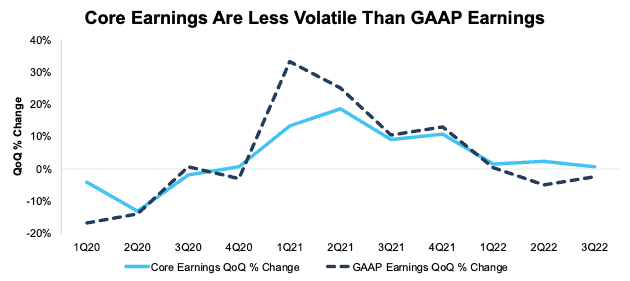
Figure 1 in the full report shows GAAP Earnings for the S&P 500 understated Core Earnings for the second consecutive quarter, after spiking to record levels in the TTM period ending in 1Q22. This drop in GAAP Earnings relative to Core Earnings follows a similar pattern from just prior to the Great Recession.
Since 2020, corporate profits have been much less volatile than GAAP earnings indicate, as Figure 1 shows. For example, in the TTM ended:
- 3Q22, GAAP earnings fell 3% QoQ compared to a 1% rise for Core Earnings.
- 2Q22, GAAP earnings fell 5% QoQ compared to a 2% rise in Core Earnings.
- 1Q21, GAAP earnings rose 33% QoQ compared to a 13% rise for Core Earnings.
Figure 1: S&P 500 Core Earnings Vs. GAAP Earnings QoQ Percent Change: 1Q20 – 3Q22
Sources: New Constructs, LLC and company filings.
Our Core Earnings analysis is based on aggregated TTM data for the sector constituents in each measurement period.
The November 25, 2022 measurement period incorporates the financial data from calendar 3Q22 10-Q, as this is the earliest date for which all the calendar 3Q22 10-Qs for the S&P 500 constituents were available.
This report leverages our cutting-edge Robo-Analyst technology to deliver proven-superior[3] fundamental research and support more cost-effective fulfillment of the fiduciary duty of care.
GAAP Earnings[4] Understate Core Earnings for More Than Half the S&P 500 (by Market Cap)
63%, or 314, of the companies in the S&P 500 report GAAP Earnings that understate Core Earnings for the TTM ended 3Q22.
When GAAP Earnings understate Core Earnings, they do so by an average of 87%, per Figure 2. For 29% of companies, GAAP Earnings understate Core Earnings by more than ten percent. For comparison, in the TTM ended 2Q22, 292 companies had understated GAAP earnings.
Figure 2: S&P 500 GAAP Earnings Understated by 87% On Average

Sources: New Constructs, LLC and company filings.
We use Funds from Operations (FFO) for Real Estate companies rather than GAAP Earnings.
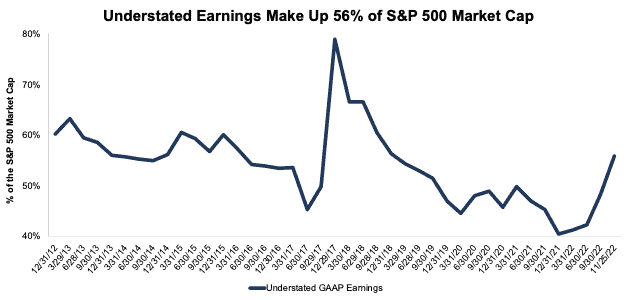
In a reversal from prior quarters, these 314 companies with understated GAAP earnings make up 56% of the market cap of the S&P 500 in 3Q22. Indeed, 3Q22 has the most understated GAAP earnings (by market cap) since 3Q18. Companies with understated GAAP earnings made up 48% of the S&P 500 market cap in 2Q22 and 40% of the S&P 500 market cap in 3Q21.
Figure 3: Understated Earnings as % of Market Cap: 2012 through 11/25/22
Sources: New Constructs, LLC and company filings.
Key Details on Select S&P 500 Sectors
Six of eleven sectors saw a quarter-over-quarter rise in Core Earnings through the trailing-twelve months (TTM) ended 3Q22, compared to seven in 2Q22.
The Energy sector saw the largest QoQ improvement in Core Earnings, which rose from $160.9 billion in 2Q22 to $201.7 billion in 3Q22, or 25%.
The Technology sector generates the most Core Earnings, at $461.6 billion, and saw Core Earnings fall 3% QoQ in 3Q22. On the flip side, the Real Estate sector has the lowest Core Earnings at $23.3 billion, and the Financials sector had the largest QoQ decline in 3Q22 at -6%.
Below we highlight the Energy sector and a stock with some of the most negative Earnings Distortion (i.e. understated GAAP earnings) in the sector.
Sample Sector Analysis[5]: Energy Sector
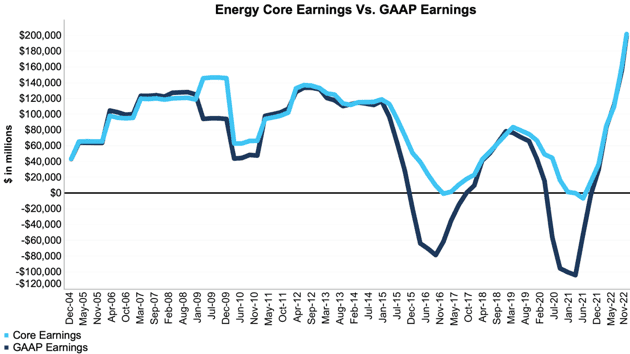
Figure 4 shows Core Earnings for the Energy sector, at $201.7 billion, rose 25% QoQ in 3Q22, while GAAP earnings, at $199.1 billion, rose 28% over the same time.
Figure 4: Energy Core Earnings Vs. GAAP: 2004 – 3Q22
Sources: New Constructs, LLC and company filings.
Our Core Earnings analysis is based on aggregated TTM data for the sector constituents in each measurement period.
The November 25, 2022 measurement period incorporates the financial data from calendar 3Q22 10-Q, as this is the earliest date for which all the calendar 3Q22 10-Qs for the S&P 500 constituents were available.
GAAP Earnings Understatement Details: Exxon Mobil (XOM)
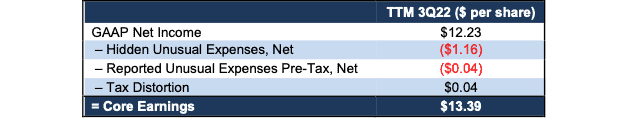
Below, we detail the hidden and reported unusual items that GAAP Earnings miss but that we capture in Core Earnings for Exxon Mobil. After adjusting for unusual items, we find that Exxon Mobil’s Core Earnings of $56.8 billion, or $13.39/share are much higher than reported GAAP Earnings of $51.9 billion, or $12.23/share.
Exxon Mobil’s Earnings Distortion Score is Beat and its Stock Rating is Attractive, in part due to its return on invested capital (ROIC) of 15% and price-to-economic book value (PEBV) ratio of 0.5.
Below, we detail the differences between Core Earnings and GAAP Earnings so readers can audit our research.
Figure 5: Exxon Mobil’s GAAP Earnings to Core Earnings Reconciliation
Sources: New Constructs, LLC and company filings.
More details:
Total Earnings Distortion of -$1.16/share, which equals $4.9 billion, is comprised of the following:
Hidden Unusual Expenses, Net = -$1.16/per share, which equals -$4.9 billion and is comprised of
- -$4.6 billion before-tax impairment of operations related to Sakhalin in 1Q22
- -$355 million in impairment charges in the TTM based on -$300 million in impairments of suspended wells, -$50 million in impairments related to upstream equity investments, and $9 million in before-tax charges in 4Q21
- $47 million in amortization of prior service costs in the TTM period based on
- $10 million in 3Q22
- $11 million in 2Q22
- $12 million in 1Q22
- $14 million in 4Q21
Reported Unusual Expenses Pre-Tax, Net = -$0.04/per share, which equals -$185 million and is comprised of
- -$482 million in non-service pension and postretirement benefit expenses in the TTM period based on
- -$154 million in 3Q22
- -$120 million in 2Q22
- -$108 million in 1Q22
- -$100 million in 4Q21
- $297 million contra adjustment for recurring pension costs. These recurring expenses are reported in non-recurring line items, so we add them back and exclude them from Earnings Distortion.
Tax Distortion = $0.04/per share, which equals $187 million
This article was originally published on December 8, 2022.
Disclosure: David Trainer, Kyle Guske II, Matt Shuler, and Italo Mendonça receive no compensation to write about any specific stock, style, or theme.
Follow us on Twitter, Facebook, LinkedIn, and StockTwits for real-time alerts on all our research.
Appendix: Calculation Methodology
We derive the Core Earnings and GAAP Earnings metrics above by summing the Trailing Twelve Month individual S&P 500 constituent values for Core Earnings and GAAP Earnings in each sector for each measurement period. We call this approach the “Aggregate” methodology.
The Aggregate methodology provides a straightforward look at the entire sector, regardless of market cap or index weighting and matches how S&P Global (SPGI) calculates metrics for the S&P 500.
[1] The Journal of Financial Economics features the superiority of our Core Earnings in Core Earnings: New Data & Evidence.
[2] Based on the latest audited financial data, which is the calendar 3Q22 10-Q in most cases. Price data as of 11/25/22.
[3] Our research utilizes our Core Earnings, a more reliable measure of profits, as proven in Core Earnings: New Data & Evidence, written by professors at Harvard Business School (HBS) & MIT Sloan and published in The Journal of Financial Economics.
[4] Overstated companies include all companies with Earnings Distortion >0.1% of GAAP earnings.
[5] The full version of this report provides analysis for all eleven sectors.