
Trailing-twelve-months (TTM) Core Earnings fell 1%, while TTM GAAP Earnings rose 2% quarter-over-quarter (QoQ) in 1Q23. Seeing GAAP earnings rise while Core Earnings decline reminds us of the more stable nature of Core Earnings. Because we remove unusual gains and losses, Core Earnings are not prone to the larger ups and downs seen in GAAP Earnings.
This report is an abridged and free version of S&P 500 & Sectors: 1Q23 GAAP Earnings Growth is An Illusion, one of our quarterly series of reports on fundamental market and sector trends.
The full version of the report analyzes Core Earnings[1],[2] and GAAP earnings for the S&P 500 and each of its sectors (last quarter’s analysis is here). The full reports are available to Professional and Institutional members.
This report leverages our cutting-edge Robo-Analyst technology to deliver proven-superior[3] fundamental research and support more cost-effective fulfillment of the fiduciary duty of care.
GAAP Earnings Rise Is Misleading in 1Q23
Our superior fundamental data protects us from being misled by false trends in un-scrubbed GAAP Earnings. The recent rise in GAAP Earnings explains part of Wall Street’s recent bullishness and our bearishness on certain stocks. Looking beyond the headlines reveals that the rise in GAAP Earnings may be an illusion for two reasons:
- it is more of a result of an exaggerated slump in the prior quarters. The kitchen sink effect in in full effect.
- Core Earnings are heading lower now, GAAP Earnings are not likely to continue their rise.
If the rise in GAAP Earnings proves to be an illusion, then investors could be in for a rude awakening if they’ve been investing in expensive stocks. See Figure 1 in the full report.
Generally Accepted Accounting Distortions
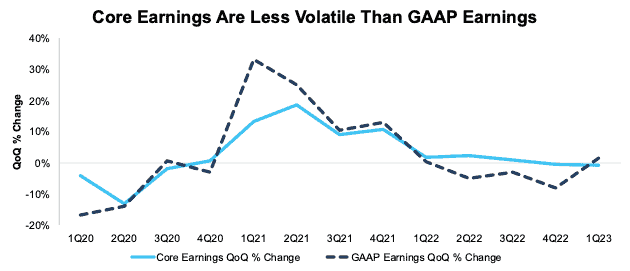
Figure 1 in the full report shows GAAP Earnings for the S&P 500 are lower than Core Earnings for the fourth consecutive quarter. Corporate profits, as measured by Core Earnings, have been much less volatile than GAAP earnings suggest, especially since 1Q20. For example, per Figure 2, in the TTM ended:
- 1Q21, GAAP earnings rose 33% QoQ compared to a 13% rise for Core Earnings.
- 2Q22, GAAP earnings fell 5% QoQ compared to a 2% rise in Core Earnings.
- 3Q22, GAAP earnings fell 3% QoQ compared to a 1% rise for Core Earnings.
- 4Q22, GAAP earnings fell 8% QoQ compared to no change in Core Earnings.
- 1Q23, GAAP earnings rose 2% QoQ compared to a 1% decline in Core Earnings.
Figure 1: S&P 500 Core Earnings Vs. GAAP Earnings QoQ Percent Change: 1Q20 – 1Q23
Sources: New Constructs, LLC and company filings.
Our Core Earnings analysis is based on aggregated TTM data for the sector constituents in each measurement period.
The May 15, 2023 measurement period incorporates the financial data from calendar 1Q23 10-Qs, as this is the earliest date for which all the calendar 1Q23 10-Qs for the S&P 500 constituents were available.
GAAP Earnings[4] Understate Core Earnings for Nearly Two-Thirds the S&P 500 (by Market Cap)
67% of the companies in the S&P 500 report GAAP Earnings that are lower than Core Earnings for the TTM ended 1Q23.
When GAAP Earnings understate Core Earnings, they do so by an average of 92%, per Figure 2. GAAP Earnings understated Core Earnings for 335 companies in the TTM ended 1Q23, compared to 350 in the TTM ended 4Q22.
Figure 2: S&P 500 GAAP Earnings Understated by 92% On Average

Sources: New Constructs, LLC and company filings.
We use Funds from Operations (FFO) for Real Estate companies rather than GAAP Earnings.
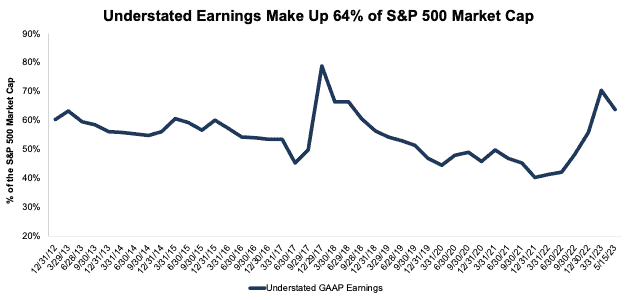
The 335 companies with understated GAAP Earnings make up 64% of the market cap of the S&P 500 as of May 15, 2023. Companies with understated GAAP earnings made up 70% of the S&P 500 market cap in 4Q22 and 42% of the S&P 500 market cap in 1Q22.
Figure 3: Understated Earnings as % of Market Cap: 2012 through 5/15/23
Sources: New Constructs, LLC and company filings.
Key Details on Select S&P 500 Sectors
Four of eleven sectors saw a QoQ rise in Core Earnings through the TTM ended 1Q23, which was the same number in 4Q22.
The Consumer Cyclicals saw the largest QoQ improvement in Core Earnings, which rose from $157.3 billion in 4Q22 to $165.5 billion in 1Q23, or 5%.
At $440.2 billion, the Technology sector generates the most Core Earnings, but saw Core Earnings fall 2% QoQ in 1Q23. On the flip side, the Real Estate sector has the lowest Core Earnings at $22.7 billion, and the Basic Materials sector had the largest QoQ decline in 1Q23 at -9%.
Below we highlight the Consumer Cyclicals sector and a stock with some of the most negative Earnings Distortion (i.e. understated GAAP earnings) in the sector.
Sample Sector Analysis[5]: Consumer Cyclicals Sector
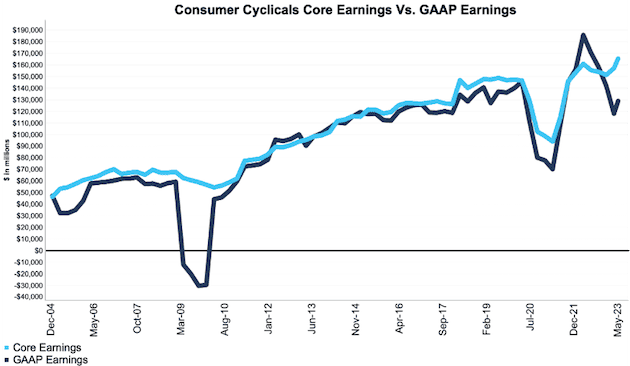
Figure 4 shows Core Earnings for the Consumer Cyclicals sector, at $165.5 billion, rose 5% QoQ in 1Q23, while GAAP earnings, at $128.9 billion, rose 9% over the same time.
Figure 4: Consumer Cyclicals Core Earnings Vs. GAAP: 2004 – 1Q23
Sources: New Constructs, LLC and company filings.
Our Core Earnings analysis is based on aggregated TTM data for the sector constituents in each measurement period.
The May 15, 2023 measurement period incorporates the financial data from calendar 1Q23 10-Qs, as this is the earliest date for which all the calendar 1Q23 10-Qs for the S&P 500 constituents were available.
GAAP Earnings Understatement Details: General Motors (GM)
Below, we detail the hidden and reported unusual items overlooked in GAAP Earnings and captured in Core Earnings for General Motors (GM). After adjusting for unusual items, we find that General Motors’ Core Earnings of $11.6 billion, or $8.08/share are much higher than reported GAAP Earnings of $9.3 billion, or $6.47/share.
General Motor’s Earnings Distortion Score is Beat and its Stock Rating is Very Attractive, in part due to its positive economic earnings, high free cash flow yield, and low price-to-economic book value (PEBV) ratio of 0.4. We made General Motors a Long Idea in March 2018. and while the stock has underperformed, it remains highly undervalued. See all our research on General Motors here.
Below, we detail the differences between Core Earnings and GAAP Earnings so readers can audit our research.
Figure 5: General Motors’ GAAP Earnings to Core Earnings Reconciliation: TTM through 1Q23

Sources: New Constructs, LLC and company filings.
More details:
Total Earnings Distortion of -$1.61/share, which equals -$2.3 billion, is comprised of the following:
Hidden Unusual Expenses Pre-Tax, Net = -$1.50/per share, which equals -$2.2 billion and is comprised of:
- -$1.4 billion in hidden restructuring expenses in the TTM period based on
- -$875 million in voluntary separation program charges on page 26 in 1Q23 10-Q
- -$99 million in Buick dealer strategy charges on page 26 in 1Q23 10-Q
- -$383 million in restructuring and other initiatives in the TTM based on $511 million charge on page 90 in the 2022 10-K
- -$1 million impairment charges in 4Q22 based on -$12 million impairment charge on page 72 in 2022 10-K
- -$11 million impairment charge on page 25 in 2Q22 10-Q
- -$793 million in cruise compensation modifications based on -$1.1 billion charge on page 27 in the 2022 10-K
Reported Unusual Expenses Pre-Tax, Net = -$0.30/per share, which equals $431 million and is comprised of:
- -$542 million in other expenses in the 2022 10-K
- $1.4 billion in interest and other non-operating income in the TTM period based on
- $409 million in 1Q23
- $102 million in 4Q22
- $598 million in 3Q22
- $295 million in 2Q22
- $238 million in licensing agreements income in 2022 10-K
- -$236 million in revaluation of investments in 2022 10-K
- $1.3 billion contra adjustment for recurring pension costs. These recurring expenses are reported in non-recurring line items, so we add them back and exclude them from Earnings Distortion.
Tax Distortion = $0.19/per share, which equals $278 million.
This article was originally published on May 31, 2023.
Disclosure: David Trainer, Kyle Guske II, and Italo Mendonça receive no compensation to write about any specific stock, style, or theme.
Questions on this report or others? Join our Society of Intelligent Investors and connect with us directly.
Appendix: Calculation Methodology
We derive the Core Earnings and GAAP Earnings metrics above by summing the Trailing Twelve Month individual S&P 500 constituent values for Core Earnings and GAAP Earnings in each sector for each measurement period. We call this approach the “Aggregate” methodology.
The Aggregate methodology provides a straightforward look at the entire sector, regardless of market cap or index weighting and matches how S&P Global (SPGI) calculates metrics for the S&P 500.
[1] The Journal of Financial Economics features the superiority of our Core Earnings in Core Earnings: New Data & Evidence.
[2] Based on the latest audited financial data, which is the calendar 1Q23 10-Q in most cases. Price data as of 5/15/23.
[3] Our research utilizes our Core Earnings, a more reliable measure of profits, as proven in Core Earnings: New Data & Evidence, written by professors at Harvard Business School (HBS) & MIT Sloan and published in The Journal of Financial Economics.
[4] Overstated companies include all companies with Earnings Distortion >0.1% of GAAP earnings.
[5] The full version of this report provides analysis for all eleven sectors.