
3Q22 Operating Earnings calculated by S&P Global (SPGI) for the S&P 500 continued to drop from record highs reached in 1Q22 and remain lower than Core Earnings[1] for the second consecutive quarter. We saw a similar trend for GAAP Earnings in 3Q22, as detailed here.
After reaching record price-to-earnings values in 2021, the S&P 500’s 15% year-to-date decline has brought its valuation more in line with historical averages. However, should earnings fall further amidst economic headwinds and rising rates, the current valuation could look expensive in hindsight. Last quarter’s analysis of Core vs. S&P Global’s Operating Earnings for the S&P 500 is here.
This report leverages our cutting-edge Robo-Analyst technology to deliver proven-superior[2] fundamental research and support more cost-effective fulfillment of the fiduciary duty of care.
Operating Earnings Misrepresent the Trend in The S&P 500’s Valuation
The drop in Operating Earnings, along with the rebound in the S&P 500 price in 3Q22, caused the S&P 500’s price-to-Operating Earnings ratio to increase from 17.5 in 2Q22 to 19.8 as of 11/25/22. Price-to-Core Earnings fell from 20.5 to 19.5 over the same time. By both measures, the market’s valuation is roughly in line with historical levels, as the average price-to-Operating Earnings ratio dating back to 2004 is 19.0 and the average price-to-Core Earnings ratio is 19.2 over the same time. However, should earnings fall (as our data suggests) in light of economic headwinds, the market’s valuation would have to decline to trade in line with historical levels.
Figure 1: Price-to-Core vs. Price-to-SPGI’s Operating Earnings: TTM as of 12/31/15 – 11/25/22
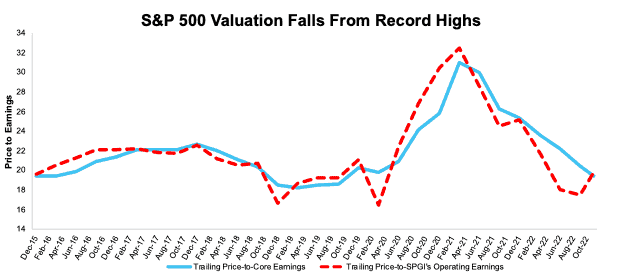
Sources: New Constructs, LLC, company filings, and S&P Global. Note: the most recent period’s data for SPGI’s Operating Earnings incorporates consensus estimates for companies with a non-standard fiscal year.
Our Core Earnings P/E ratio is aggregating the TTM results for constituents through 6/30/13 and aggregating four quarters of results for the S&P 500 constituents in each measurement period thereafter. SPGI’s P/E is based on four quarters of aggregated S&P 500 results in each period. More details in Appendix II.
S&P Global's Operating Earnings Continue Decline in 3Q22
SPGI’s Operating Earnings do not exclude the unusual items that exaggerated the rebound in 2021 and understate profits in 3Q22.
Figure 2 shows Operating Earnings for the S&P 500 understated Core Earnings for the second consecutive quarter in 3Q22. Operating Earnings fell 1% quarter-over-quarter (QoQ) compared to a 1% rise in Core Earnings. Operating Earnings are 3% lower than Core Earnings in the trailing-twelve-months (TTM) ended 3Q22. For reference, Operating Earnings were 1% lower than Core Earnings in the TTM ended 2Q22.
On an annual basis, Core Earnings increased 17% year-over-year (YoY) compared to a 7% YoY rise in Operating Earnings.
Figure 2: Trailing Twelve Month Earnings: Core Earnings vs. SPGI Operating Earnings: 4Q19 –3Q22
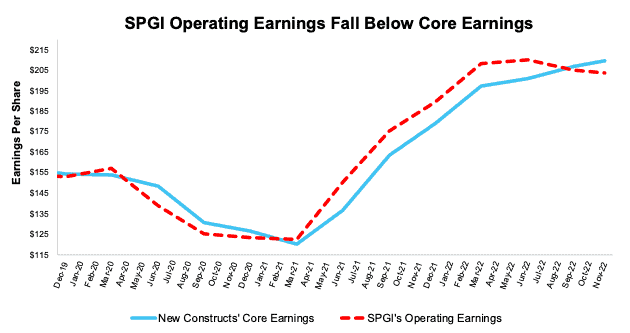
Sources: New Constructs, LLC, company filings, and S&P Global (SPGI). Note: the most recent period’s data for SPGI’s Operating Earnings is based on consensus estimates for companies with a non-standard fiscal year.
More details on the Core Earnings calculation are available in Appendix I.
Core Earnings Are Less Volatile and More Reliable than S&P Global's Operating Earnings
Figure 3 highlights the percentage changes in Core Earnings and SPGI’s Operating Earnings from 2004 through 11/25/22. Flaws in legacy datasets lead to a failure to capture unusual gains/losses buried in footnotes (detailed in The Journal of Financial Economics) and drive the difference between the two measures of earnings.
Figure 3: Core vs. SPGI’s Operating Earnings per Share for the S&P 500 – % Change: 2004 – 11/25/22
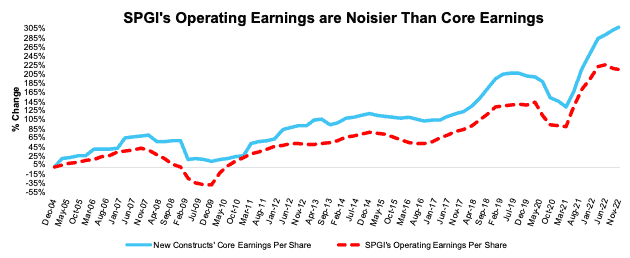
Sources: New Constructs, LLC, company filings, and S&P Global (SPGI). Note: the most recent period’s data for SPGI’s Operating Earnings incorporates consensus estimates for companies with a non-standard fiscal year.
Our Core Earnings analysis is based on aggregated TTM data through 6/30/13, and aggregated quarterly data thereafter for the S&P 500 constituents in each measurement period.
This article was originally published on December 16, 2022.
Disclosure: David Trainer, Kyle Guske II, Matt Shuler, and Italo Mendonça receive no compensation to write about any specific stock, style, or theme.
Follow us on Twitter, Facebook, LinkedIn, and StockTwits for real-time alerts on all our research.
Appendix I: Core Earnings Methodology
In the Figures above, we use the following to calculate Core Earnings:
- aggregated annual data for constituents in the S&P 500 for each measurement period through 6/30/13
- aggregated quarterly data for constituents in the S&P 500 for each measurement period post 6/30/13 to the present
While we prefer aggregated quarterly numbers, we have examined the potential impacts of the two methodologies and have found no material differences.
Appendix II: P/E Ratio Methodology for Core & SPGI’s Operating Earnings
In Figure 1 above, we calculate the price-to-Core Earnings ratio through 6/30/13 as follows:
- Calculate a TTM earnings yield for every S&P 500 constituent
- Weight the earnings yields by each stock’s respective S&P 500 weight
- Sum the weighted earnings yields and take the inverse (1/Earnings Yield)
We calculate the price-to-Core Earnings ratio for periods post 6/30/13 as follows:
- Calculate a trailing four quarters earnings yield for every S&P 500 constituent
- Weight the earnings yield by each stock’s respective S&P 500 weight
- Sum the weighted earnings yields and take the inverse (1/Earnings Yield)
We use the earnings yield methodology because P/E ratios don’t follow a linear trend. A P/E ratio of 1 is “better” than a P/E ratio of 30, but a P/E ratio of 30 is “better” than a P/E ratio of -15. In other words, aggregating P/E ratios can result in a low multiple due the inclusion of just a few stocks with negative P/Es.
Using earnings yields solves this problem because a high earnings yield is always “better” than a low earnings yield. There is no conceptual difference when flipping from positive to negative earnings yields as there is with traditional P/E ratios.
By using quarterly data as soon as its available, we better capture the impact of changes to S&P 500 constituents on a quarterly basis. For example, a company could be a constituent in 2Q18, but not in 3Q18. This method captures the continuously changing nature of the S&P 500 constituency.
For all periods in Figure 1, we calculate the price-to-SPGI’s Operating Earnings ratio by summing the preceding 4 quarters of Operating Earnings per share and, then, dividing by the S&P 500 price at the end of each measurement period.
[1] Our Core Earnings research is based on the latest audited financial data, which is the calendar 3Q22 10-Q in most cases. Price data as of 11/25/22. Operating Earnings from S&P Global is based on the same time frame.
[2] Our research utilizes our Core Earnings, a more reliable measure of profits, as proven in Core Earnings: New Data & Evidence, written by professors at Harvard Business School (HBS) & MIT Sloan and published in The Journal of Financial Economics.