
Trailing-twelve-months (TTM) 2Q23 Operating Earnings calculated by S&P Global (SPGI) for the S&P 500 rose 4% quarter-over-quarter (QoQ) in 2Q23 after rising 2% QoQ in 1Q23. This increase is misleading, as our proven-superior Core Earnings[1], which remove unusual gains and losses, fell 3% QoQ. We saw similarly misleading growth in GAAP Earnings in 2Q23, as detailed here.
Operating Earnings rising while stock prices fell drove the S&P 500’s price-to-operating earnings ratio lower. However, the price-to-Core Earnings ratio rose (got more expensive) in the TTM ended 8/15/23, as prices fell while Core Earnings fell. Last quarter’s analysis of Core vs. S&P Global’s Operating Earnings for the S&P 500 is available here.
S&P Global's Operating Earnings Improvement is Misleading
Our superior fundamental data protects investors from being misled by false trends in other earnings measures. SPGI’s TTM Operating Earnings per share increased 4% QoQ in 2Q23, while Core Earnings per share fell 3%. Because Core Earnings remove all unusual gains and losses, they are more representative of true, normal profits and are not as volatile as Operating Earnings.
After the QoQ rise in 2Q23, TTM Operating Earnings per share for the S&P 500 are higher than TTM Core Earnings for the first time since 1Q22. Operating Earnings are 2% higher than Core Earnings in the TTM ended 2Q23. For reference, Operating Earnings were 4%[2] lower than Core Earnings in the TTM ended 1Q23.
Figure 1: TTM Earnings: Core Earnings vs. SPGI Operating Earnings: 1Q20 – 2Q23
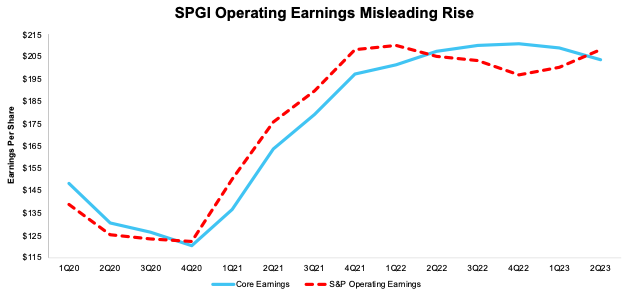
Sources: New Constructs, LLC, company filings, and S&P Global (SPGI). Note: the most recent period’s data for SPGI’s Operating Earnings is based on consensus estimates for companies with a non-standard fiscal year.
More details on the Core Earnings calculation are available in Appendix I.
Core Earnings Are More Reliable than S&P Global's Operating Earnings
Figure 2 highlights the percentage changes in Core Earnings and SPGI’s Operating Earnings from 2004 through 8/15/23. Flaws in legacy datasets lead to a failure to capture unusual gains and losses buried in footnotes (detailed in The Journal of Financial Economics) and drive the difference between the two measures of earnings.
Figure 2: Core vs. SPGI’s Operating Earnings per Share for the S&P 500 – % Change: 2004 – 8/15/23
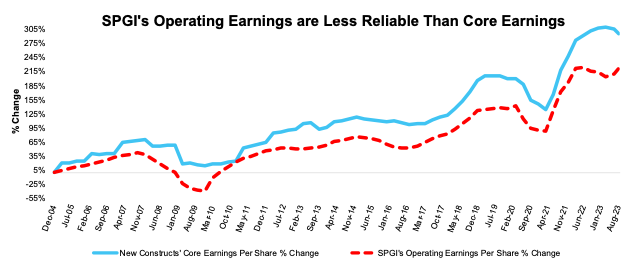
Sources: New Constructs, LLC, company filings, and S&P Global (SPGI). Note: the most recent period’s data for SPGI’s Operating Earnings incorporates consensus estimates for companies with a non-standard fiscal year.Our Core Earnings analysis is based on aggregated TTM data through 6/30/13, and aggregated quarterly data thereafter for the S&P 500 constituents in each measurement period.
Operating Earnings Misrepresent the Trend in The S&P 500’s Valuation
The rise in Operating Earnings while the S&P 500’s price fell from 6/30/23 through 8/15/23 caused the S&P 500’s price-to-Operating Earnings ratio to fall from 22.2 as of 6/30/23 to 21.3 as of 8/15/23. Meanwhile, the price-to-Core Earnings ratio increased from 19.6 to 21.2 over the same time. Investors only analyzing Operating Earnings would think the market is getting cheaper when Core Earnings show the exact opposite.
At 21.2, the price-to-Core Earnings ratio is now above its long-term average (2004-present) of 19.3. We interpret this data as showing that the market looks more expensive now despite declines in most of the major market indices.
Figure 3: Price-to-Core vs. Price-to-SPGI’s Operating Earnings: TTM as of 12/31/15 – 8/15/23
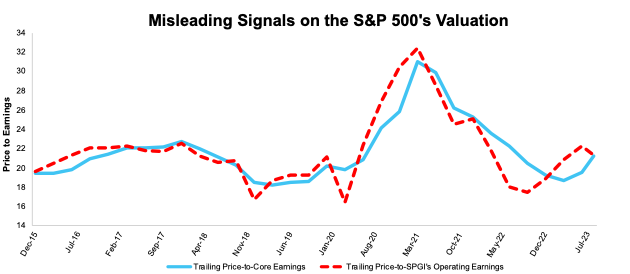
Sources: New Constructs, LLC, company filings, and S&P Global. Note: the most recent period’s data for SPGI’s Operating Earnings incorporates consensus estimates for companies with a non-standard fiscal year.Our Core Earnings P/E ratio is aggregating the TTM results for constituents through 6/30/13 and aggregating four quarters of results for the S&P 500 constituents in each measurement period thereafter. SPGI’s P/E is based on four quarters of aggregated S&P 500 results in each period. More details in Appendix II.
This article was originally published on September 8, 2023.
Disclosure: David Trainer, Kyle Guske II, Italo Mendonça, and Hakan Salt receive no compensation to write about any specific stock, style, or theme.
Questions on this report or others? Join our Society of Intelligent Investors and connect with us directly.
Appendix I: Core Earnings Methodology
In the Figures above, we use the following to calculate Core Earnings:
- aggregated annual data for constituents in the S&P 500 for each measurement period through 6/30/13
- aggregated quarterly data for constituents in the S&P 500 for each measurement period post 6/30/13 to the present
While we prefer aggregated quarterly numbers, we have examined the potential impacts of the two methodologies and have found no material differences.
Appendix II: P/E Ratio Methodology for Core & SPGI’s Operating Earnings
In Figure 3 above, we calculate the price-to-Core Earnings ratio through 6/30/13 as follows:
- Calculate a TTM earnings yield for every S&P 500 constituent
- Weight the earnings yields by each stock’s respective S&P 500 weight
- Sum the weighted earnings yields and take the inverse (1/Earnings Yield)
We calculate the price-to-Core Earnings ratio for periods post 6/30/13 as follows:
- Calculate a trailing four quarters earnings yield for every S&P 500 constituent
- Weight the earnings yield by each stock’s respective S&P 500 weight
- Sum the weighted earnings yields and take the inverse (1/Earnings Yield)
We use the earnings yield methodology because P/E ratios don’t follow a linear trend. A P/E ratio of 1 is “better” than a P/E ratio of 30, but a P/E ratio of 30 is “better” than a P/E ratio of -15. In other words, aggregating P/E ratios can result in a low multiple due the inclusion of just a few stocks with negative P/Es.
Using earnings yields solves this problem because a high earnings yield is always “better” than a low earnings yield. There is no conceptual difference when flipping from positive to negative earnings yields as there is with traditional P/E ratios.
By using quarterly data as soon as its available, we better capture the impact of changes to S&P 500 constituents on a quarterly basis. For example, a company could be a constituent in 2Q18, but not in 3Q18. This method captures the continuously changing nature of the S&P 500 constituency.
For all periods in Figure 3, we calculate the price-to-SPGI’s Operating Earnings ratio by summing the preceding 4 quarters of Operating Earnings per share and, then, dividing by the S&P 500 price at the end of each measurement period.
[1] Our Core Earnings research is based on the latest audited financial data, which is the calendar 2Q23 10-Q in most cases. Price data as of 8/15/23. Operating Earnings from S&P Global is based on the same time frame.
[2] Note that 1Q23 values may be different than reported for the same period in last quarter’s report because the more recent data captures more companies, specifically the companies that filed 10-Ks or 10-Qs after the “as of” cutoff date for the last report.