
Our report on Overstated Street Earnings in 1Q23 shows Street Earnings (based on Zacks Earnings) overstate profits for the majority of S&P 500 companies in 1Q23. However, there are nearly 150 S&P 500 companies with TTM 1Q23 Street Earnings that are lower than their true profits, i.e. Core Earnings[1],[2]. These companies are more profitable than investors realize and, in many cases, undervalued.
This report shows:
- the magnitude of understated Street Earnings in the S&P 500
- why Street Earnings (and GAAP earnings) are flawed
- five S&P 500 companies with understated Street Earnings and Very Attractive Stock Ratings
146 S&P 500 Companies Have Understated Street Earnings
For 146 companies in the S&P 500, or 29%, Street Earnings are lower than Core Earnings in the trailing-twelve-months (TTM) ended 1Q23. In the TTM ended 4Q22, Street Earnings were understated for 154 companies.
When Street Earnings are lower than Core Earnings, they are understated by an average of 21% per company, per Figure 1.
Figure 1: Street Earnings Understated by 21% on Average in TTM Through 1Q23[3]

Sources: New Constructs, LLC and company filings.
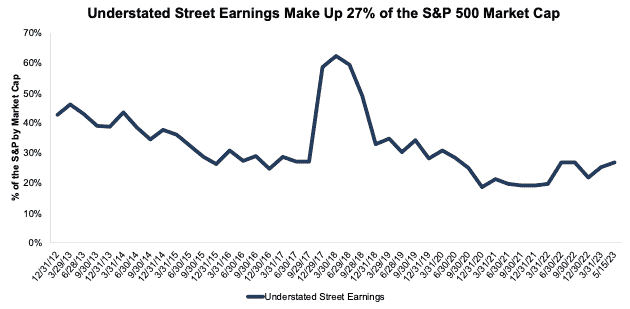
The 146 companies with understated Street Earnings represent 27% of the market cap of the S&P 500 as of 5/15/23, which is up from 25% in the TTM ended 4Q22.
Figure 2: Understated Street Earnings as % of Market Cap: 2012 through 5/15/23
Sources: New Constructs, LLC and company filings.
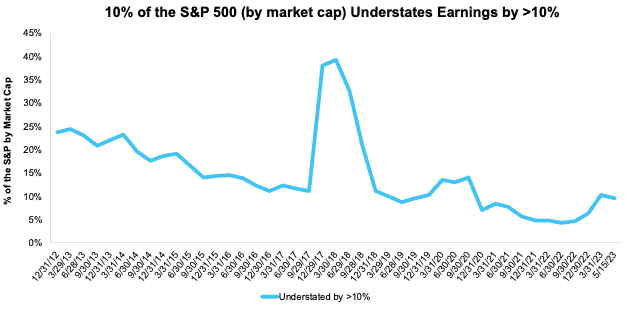
For 51 companies, Street Earnings are overstated by more than 10% vs. Core Earnings. These 51 companies make up 10% of the market cap of the S&P 500 as of 5/15/23. See Figure 3.
Figure 3: Understated Street Earnings by 10% as % of Market Cap: 2012 through 5/15/23
Sources: New Constructs, LLC and company filings.
The Five Most Understated Earnings in the S&P 500
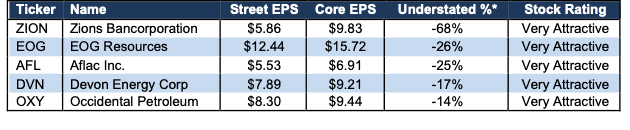
Figure 4 shows five S&P 500 stocks with Very Attractive Stock Ratings and the most understated Street Earnings (based on Street Distortion as a % of Street Earnings per share) in the TTM ended 1Q23. “Street Distortion” equals the difference between Core and Street Earnings on a per share basis. Investors relying only on Street Earnings miss the true profitability of these businesses.
Figure 4: S&P 500 Companies with Most Understated Street Earnings: TTM 1Q23
Sources: New Constructs, LLC and company filings.
*Measured as Street Distortion as a percent of Street EPS
In the section below, we detail the hidden and reported unusual items that distort GAAP Earnings for Occidental Petroleum (OXY). All these unusual items are removed from Core Earnings.
Occidental’s TTM 1Q23 Street Earnings Understated by $1.14/share
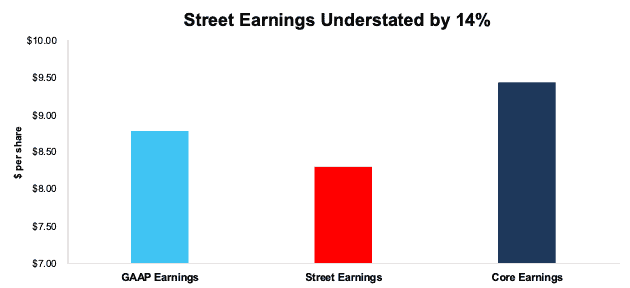
The difference between, or Street Distortion in, Occidental’s TTM 1Q23 Street Earnings ($8.30/share) and Core Earnings ($9.44/share) is $1.14/share, or 14% of Street Earnings.
Occidental’s TTM 1Q23 GAAP Earnings ($8.79/share) are $0.65/share lower than Core Earnings, which indicates that Street Earnings are even more understated and miss more of the unusual items that distort GAAP Earnings for Occidental. Our proprietary process for adjusting financial filings corrects these inaccuracies and reflects true profitability.
Figure 5: Comparing Occidental’s GAAP, Street, and Core Earnings: TTM 1Q23
Sources: New Constructs, LLC and company filings.
Below, we detail the differences between Core Earnings and GAAP Earnings so readers can audit our research. We would be happy to reconcile our Core Earnings with Street Earnings but cannot because we do not have the details on how analysts calculate their Street Earnings.
Occidental’s Earnings Distortion Score is Beat and its Stock Rating is Very Attractive, in part due to its positive economic earnings, return on invested capital (ROIC) of 11% and price-to-economic book value (PEBV) ratio of 0.5.
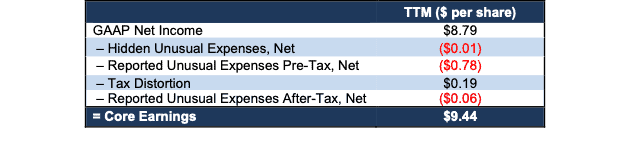
Figure 6 details the differences between Occidental’s Core Earnings and GAAP Earnings.
Figure 6: Occidental’s GAAP Earnings to Core Earnings Reconciliation: TTM 1Q23
Sources: New Constructs, LLC and company filings.
More details:
Total Earnings Distortion of -$0.65/share, which equals -$649 million, is comprised of the following:
Hidden Unusual Expenses, Net = -$0.01/per share, which equals -$7.5 million and is comprised of:
- -$63 million in dry hole expenses in the TTM based on -$84 million in the 2022 10-K
- $9 million gain in the TTM based on $9 million recognized prior service credit in the 2022 10-K
- $47 million gain on sale of limited partner units in the TTM based on $62 million gain in the 2022 10-K
Reported Unusual Expenses Pre-Tax, Net = -$0.78/per share, which equals -$775 million and is comprised of:
- -$1.3 billion in other operating and non-operating expenses in the TTM period based on
- -$308 million in 1Q23
- -$362 million in 4Q22
- -$319 million in 3Q22
- -$291 million in 2Q22
- -$24 million in Anadarko acquisition-related costs in the TTM period based on
- -$7 million in 4Q22
- -$4 million in 3Q22
- -$13 million in 2Q22
- $133 million in interest, dividends, and other income in the TTM period based on
- $29 million in 1Q23
- $31 million in 4Q22
- $37 million in 3Q22
- $36 million in 2Q22
- $177 million in gains on sales of assets and equity investment in the TTM period based on
- $4 million in 1Q23
- $76 million in 4Q22
- $74 million in 3Q22
- $23 million in 2Q22
- $182 million in gains on interest rate swaps in the TTM period based on
- -$15 million loss in 4Q22
- $70 million gain in 3Q22
- $127 million gain in 2Q22
- -$37 million contra adjustment for recurring pension costs. These recurring expenses are reported in non-recurring line items, so we add them back and exclude them from Earnings Distortion.
Tax Distortion = $0.19/per share, which equals $189 million
Reported Unusual Expenses After-Tax, Net = -$0.06/per share, which equals -$55 million and is comprised of:
- -$55 million in net income allocated to participating securities in the TTM period based on
- -$6 million in 1Q23
- -$3 million in 4Q22
- -$18 million in 3Q22
- -$28 million in 2Q22
Street Earnings being even lower than GAAP Earnings for Occidental indicate that Street Earnings miss many of the unusual items in GAAP Earnings. The $1.14/share Street Distortion highlights that Core Earnings include a more comprehensive set of unusual items when calculating Occidental’s true profitability.
This article was originally published on June 2, 2023.
Disclosure: David Trainer, Kyle Guske II, and Italo Mendonça receive no compensation to write about any specific stock, style, or theme.
Questions on this report or others? Join our Society of Intelligent Investors and connect with us directly.
[1] The Journal of Financial Economics features the superiority of our Core Earnings in Core Earnings: New Data & Evidence.
[2] Our Core Earnings research is based on the latest audited financial data, which is the calendar 1Q23 10-Q in most cases. Price data as of 5/15/23.
[3] Average understated % is calculated as Street Distortion, which is the difference between Street Earnings and Core Earnings.