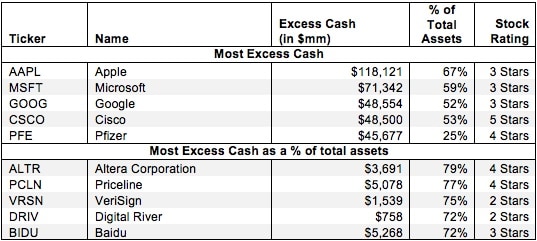
Most companies hold some cash—or cash equivalents in the form of investments—above this required amount. Companies hold excess cash in order to cushion against economic downturns, prepare for acquisitions, or any number of other reasons. Sometimes, past profits pile up on balance sheets and are a form of excess cash. Excess cash is not needed for the operations of a company. It is removed from our calculation of invested capital.
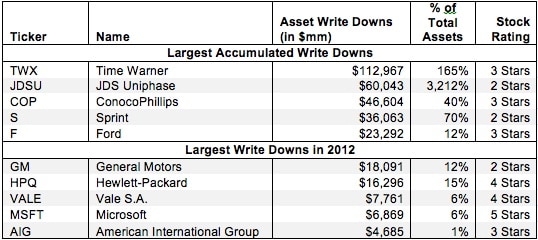
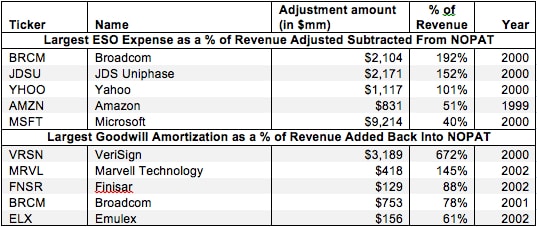
For debt investors, which GAAP was primarily designed for, write-downs are analytically helpful. They provide a more accurate assessment of the liquidation value of a company’s assets. For equity investors, on the other hand, write-downs are not helpful because they distort the return on invested capital (ROIC) of a company.
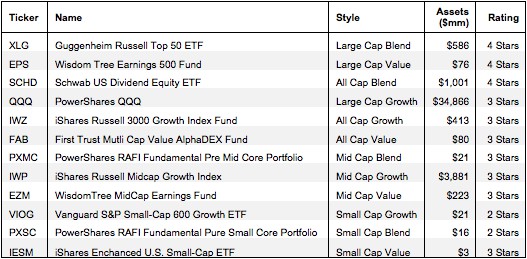
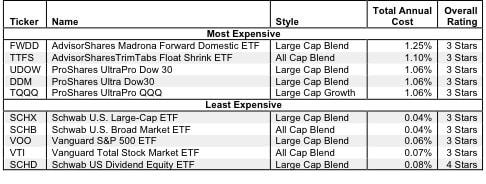
This report identifies the “best” ETFs and mutual funds based on the quality of their holdings and their costs. As detailed in “Low-Cost Funds Dupe Investors”, there are few funds that have both good holdings and low costs. While there are lots of cheap funds, there are very few with high-quality holdings.
NOPAT Adjustments for ESOs and Goodwill Amortization. Converting GAAP data into economic earnings should be part of every investor’s diligence process. Performing detailed analysis of footnotes and the MD&A is part of fulfilling fiduciary responsibilities.
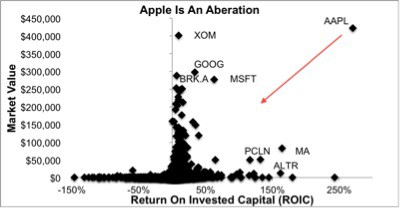
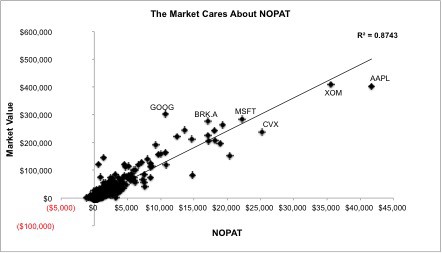
This article provides some empirical evidence behind my putting Apple (AAPL) in the Danger Zone last week because its return on invested capital (ROIC) is outrageously high. That fact underscores why valuing this company or any other with the expectation that such a high ROIC was sustainable would be a mistake.
Too many investors are looking at AAPL through the rear view mirror and assume that its sky-high profits and return on invested capital (ROIC) are sustainable. As I detail in my CNBC interview, Apple is not cheap and investors should not underestimate the impact of losing Steve Jobs.
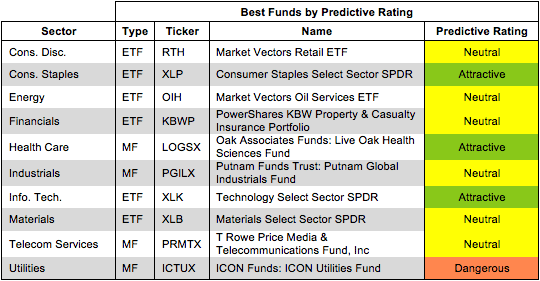
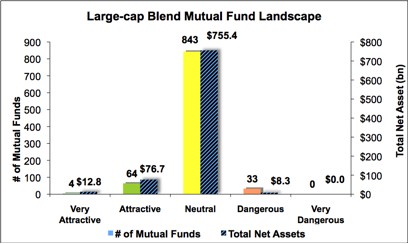
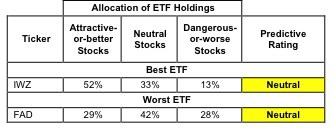
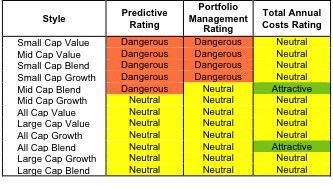
The large-cap blend style ranks first out of the twelve fund styles as detailed in my Style Rankings for ETFs and Mutual Funds report. It gets my Neutral rating, which is based on aggregation of ratings of 33 ETFs and 944 mutual funds in the large-cap blend style as of February 1st, 2013.
The all-cap growth style ranks fifth out of the twelve fund styles as detailed in my style rankings for ETFs and mutual funds. It gets my Neutral rating, which is based on aggregation of ratings of two ETFs and 490 mutual funds in the all-cap growth style as of October 17, 2012.
The best ETFs and mutual funds have high-quality holdings and low costs. As detailed in “A cheap fund is not always a good fund”, there are few funds that have both good holdings and low costs. While there are lots of cheap funds, there are very few with high-quality holdings.
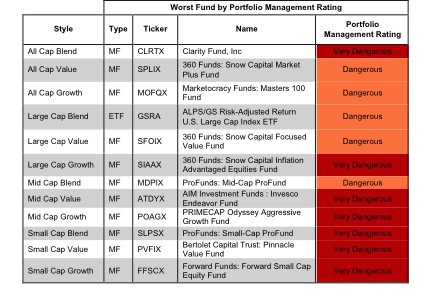
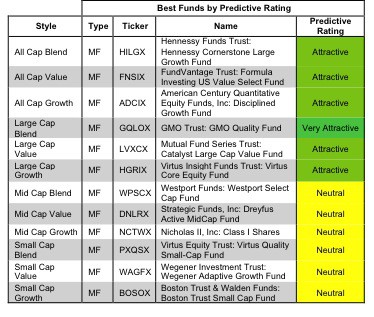
None of the fund styles earn a rating better than Neutral. The primary driver behind the Neutral-or-worse ratings is poor portfolio management. My style ratings are based on the aggregation
MSFT gets my best rating because the company’s ROIC, at 72%, ranks 8th in the S&P 500 while its stock price (~$31.52/share) implies the company’s profits will permanently decline by about 20%. High profitability and low valuation create excellent risk/reward in a stock. Here is my free report on MSFT.
First, you need to determine the category or sector to which you want exposure.
Then, you determine which ETFs, within the category or sector you like, are the best …this can be the hard part.
The radically higher number of US equity mutual funds (4,700+) versus ETFs (380+) is not indicative of better stock selection from active management. On the contrary, the vast majority of actively-managed funds do not justify the higher fees they charge. They do not, in terms of stock selection and expected returns, add value versus passively managed benchmarks.