
As traditional value factors and value investing, in general, lose their luster, investors have turned to old tricks, such as capitalizing expenses, to justify buying stocks at overvalued levels.
Buyer beware though. This report shows, mathematically, that capitalizing expenses is, largely, a fool’s errand. Capitalizing expenses has no effect on free cash flow (FCF)[1] and little impact on the return on invested capital (ROIC) of a business, except to disguise poor businesses[2].
Capitalizing Vs. Expensing – What It Means
In general, a company can either expense or capitalize a given cost, a decision that affects where the cost appears on a company’s financial statements.
- Expensing: the cost is recorded on the income statement in the period the expense is incurred.
- Capitalizing: the cost is recorded on the balance sheet as an asset and an amortization of that asset replaces the expense on the income statement.
Key Assumptions to Make When Capitalizing Expenses
Before choosing to capitalize an expense, one must make key assumptions that materially affect results.
Assumption 1: For How Many Years Should the Expense Be Capitalized? When capitalizing an expense, one must make an assumption about its useful life, which determines the depreciation/amortization expense reported on the income statement and the capitalized asset value on the balance sheet. For example, if a company buys a tractor for $100 and assumes a 5-year useful life, then, the company records an $80 asset on its balance sheet and a $20 depreciation expense on its income statement in the first year of the asset’s useful life.
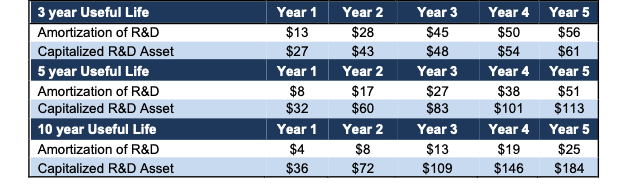
In Figure 1, we present the impact of different useful life assumptions. As shown, the longer the assumed useful life of the R&D, the lower the amortization cost on the income statement and the higher the asset recorded on the balance sheet.
Figure 1: Longer Useful Life Assumptions Decrease Expenses on the Income Statement
Sources: New Constructs, LLC
This analysis is based on a hypothetical company with $100 million in revenue that grows its revenue 12% a year with R&D expense at 40% of revenue in each year. Click here for a copy of the model used to produce this analysis.
Assumption 2: When Should the Capitalization Process Start? For a company with multiple years of operating history, analysts can choose from two options to start the capitalization process:
- Start in the current period forward: This option eliminates comparability to prior years’ results.
- Start in the first year of R&D: This option will reduce the impact of capitalization in the current period and may not produce results materially different from not capitalizing. As shown in Figure 4 and Figure 5, over the longer term, the difference between the amortization of R&D and actual R&D diminishes to almost zero.
Whatever one chooses, transparency is key. Without clear disclosure of when capitalization of expenses begins, investors lack the necessary information to properly assess the research based on it.
Capitalizing Expenses Provides Huge Boost to Earnings
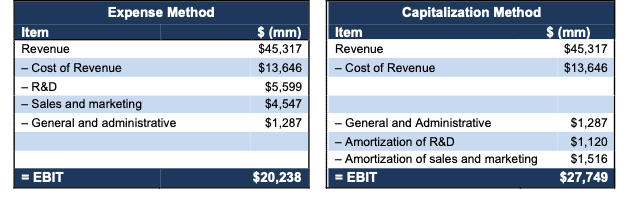
In the short term, a company’s decision to capitalize has a large impact on earnings. Figure 2 illustrates what Microsoft’s (MSFT) fiscal 1Q22 income statement looks like using the expense method, and what it would look like when capitalizing R&D and sales and marketing expenses. For this example, R&D expenses are capitalized over five years and sales and marketing expenses are capitalized over three years.
If Microsoft capitalized R&D and sales and marketing in fiscal 1Q22, its earnings before interest and taxes (EBIT) would be 37% higher than its chosen expense method. Click here for the model used to produce these results.
Figure 2: Capitalization vs. Expense: Impact on Microsoft’s Fiscal 1Q22 Income Statement
Sources: New Constructs, LLC
Capitalization Has No Impact on Free Cash Flow
While capitalizing expense provides a big boost to earnings in the short term, it has no impact on a company’s free cash flow because it simply moves the expense from the income statement to the balance sheet.
Figures 3 and 4 show how free cash flow remains unchanged in scenario 1 and scenario 2 outlined below.
- Scenario 1: costs are expensed
- Scenario 2: R&D and sales and marketing expenses are capitalized over 5 and 3 years, respectively
- Scenario 3: sales & marketing expenses are capitalized, R&D expenses are expensed
- Scenario 4: R&D expenses are capitalized, sales & marketing expenses are expensed
In each scenario, the hypothetical company has $100 million in revenue in year one, and:
- Revenue grows 12% each year
- R&D equals 40% of revenue in each year
- Sales & marketing equals 15% of revenue in each year
- Expenses are capitalized starting in year 1
Scenario 1: Expensing R&D and Sales & Marketing
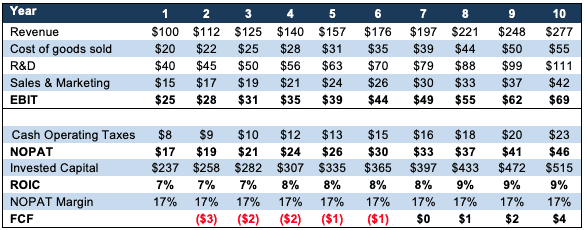
In this scenario, we expense both R&D and sales & marketing. Figure 3 shows the income statement, along with NOPAT, NOPAT margin, invested capital, ROIC, and FCF when costs are expensed each year.
The example firm in Scenario 1 generates $6 million in free cash flow in year 11, NOPAT is $52 million, and invested capital is $561 million.
Figure 3: Sample Financials: Scenario 1: Costs Are Expensed ($ in millions)
Sources: New Constructs, LLC
Scenario 2: R&D and Sales & Marketing Are Capitalized
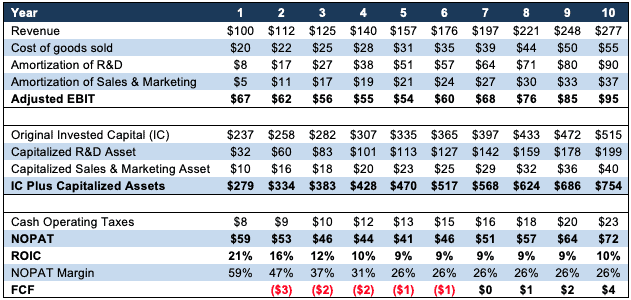
In this scenario, we capitalize both R&D and sales & marketing. The example firm in this scenario generates the same FCF in every period as Scenario 1.
FCF is identical because the actual expenditures of the business remain the same, even though they’re disclosed in different places. In other words, the increase in NOPAT in Scenario 2 vs. Scenario 1 is exactly offset by the increase in the change in invested capital in Scenario 2 vs. Scenario 1.
Figure 4: Sample Financials Scenario 2: Capitalizing R&D & Sales & Marketing ($ in millions)
Sources: New Constructs, LLC and company filings.
We present details on scenarios 3 and 4 in the Appendix. Click here for a copy of the model used to produce each scenario.
Capitalization Has Little Impact on ROIC Long Term, Too
Figure 5 charts the impact on a company’s ROIC in the four scenarios outlined above. The more capitalization of expenses, the higher the ROIC in the early years. Within a few years, however, ROIC, like Free Cash Flows is the same no matter how much expenses are capitalized.
In any of the scenarios where expenses are capitalized, ROIC is higher in early years because capitalizing expenses improves the income statement and NOPAT Margin more than it burdens invested capital. Moving expenses from the income statement to the balance sheet boosts profits more than it hurts capital efficiency.
For example, in year 1, NOPAT in Scenario 2 is over 3x higher than NOPAT in Scenario 1, but invested capital in Scenario 2 is just 18% higher than Scenario 1. However, as the amortization of the capitalized expenses increases over time, the disproportionate boost to profits diminishes.
Figure 5: Capitalizing Expenses Scenarios and The Impact on ROIC
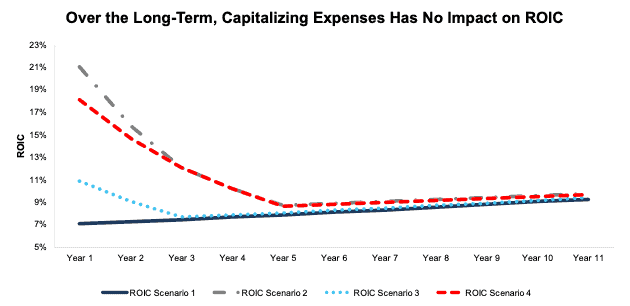
Sources: New Constructs, LLC
Cash Is King
As shown above, capitalizing expenses does not affect the underlying economics of businesses, though it can make EPS and ROIC deceptively higher in the short term.
Don't Let Creative Accounting Fool You, Focus on the Economics of the Business
We would be remiss if we did not mention two popular accounting tricks for making companies look more profitable and valuable no matter how much they spend.
- Assuming the expenses do not exist by taking them off the income statement and never putting them on the balance sheet properly, or
- Valuing the company based on the capitalized value of the expenses.
While discerning investors would dismiss these approaches as lacking accounting integrity, we’ve seen a growing interest in these approaches, if for no other reason than that they allow investors to justify the astronomical valuations of companies in today’s market.
Instead of inventing new math to explain a company’s valuation, investors would be better served to use more reliable fundamental data, proven to generate novel alpha, that gets to the core of a company’s cash flows and true profitability. Only then, investors can cut through the flaws of traditional research and truly understand a company’s valuation.
This article originally published on February 15, 2022.
Disclosure: David Trainer, Kyle Guske II, and Matt Shuler receive no compensation to write about any specific stock, sector, style, or theme.
Follow us on Twitter, Facebook, LinkedIn, and StockTwits for real-time alerts on all our research.
Appendix: Data for Scenarios 3 and 4
Below we provide the data behind Scenarios 3 and 4 above.
Scenario 3: Sales & Marketing Expenses Are Capitalized While R&D Expenses Are Expensed
In this scenario, we capitalize sales & marketing expenses and expense R&D expenses. Figure I shows how this treatment would impact NOPAT, invested capital, FCF, NOPAT margin, and ROIC.
Figure I: Sample Financials: Scenario 3: Expensing R&D and Capitalizing Sales & Marketing
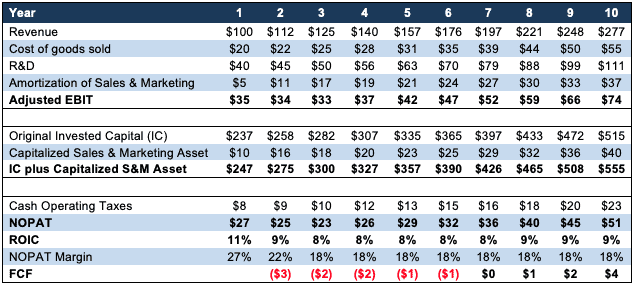
Sources: New Constructs, LLC and company filings.
Scenario 4: R&D Expenses Are Capitalized While Sales & Marketing Expenses Are Expensed
In this scenario, we capitalize R&D and expense sales & marketing. Figure II shows how this treatment would impact NOPAT, invested capital, FCF, NOPAT margin, and ROIC. Once again, FCF remains the same in Scenario 4 and in all other Scenarios. ROIC is higher in Scenario 4 than Scenario 3 in early years, given R&D is a larger expense being capitalized. However, over time, the amortization and higher invested capital result in a similar ROIC.
Figure II: Sample Financials: Scenario 4: Capitalizing R&D and Expensing Sales & Marketing
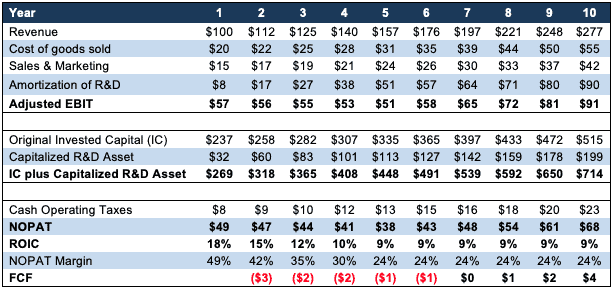
Sources: New Constructs, LLC and company filings.
[1] Free Cash Flow equals NOPAT minus the change in Invested Capital.
[2] Our investment research can provide analysis of corporate performance based on both capitalized and non-capitalized expenses.