
Earnings season is fast approaching, and with it comes the usual whirlwind of numbers, narratives, and noise. As you know, safely navigating earnings season requires more than just skimming press releases or chasing flashy metrics.
Success doesn’t go to those who follow the crowd or latch onto “adjusted” EBITDA figures dressed up for investor decks. One must consider all of the available information in company filings, including, and most importantly, the footnotes.
Our high-quality fundamental research incorporates the footnotes and is proven to generate novel alpha. We showcase how to make the best use out of our fundamental data this earnings season by identifying five stocks most likely to beat estimates and five stocks most likely to miss estimates. Stay ahead of the game with our due diligence.
To further demonstrate how our superior research creates alpha, we are sharing a free stock pick from our Most Attractive Stocks Model Portfolio, which identifies the best stocks in the market, i.e. the stocks that are not only undervalued but also possess strong fundamentals.
This pick comes with a concise summary, not a full Long Idea report. The summary provides insight into the rigor of our research and approach to picking stocks. Whether you’re a subscriber or not, we think it is important, especially in today’s volatile market environment, that you’re able to see our research on stocks. We’re proud to share our work, and we want to help investors when they need it most.
Keep an eye out for the free pick from our Most Dangerous Stocks Model Portfolio, which will be published this week as well!
We hope you enjoy this research. Feel free to share with friends and colleagues!
We update this Model Portfolio monthly. The latest Most Attractive and Most Dangerous stocks Model Portfolios were updated and published for clients on July 2, 2025.
Free Most Attractive Stocks Pick: Allison Transmission Holdings Inc. (ALSN)
Allison Transmission (ALSN: $95/share) has grown revenue and net operating profit after tax (NOPAT) by 4% and 9% compounded annually since 2014, respectively. Allison Transmission’s NOPAT margin increased from 15% in 2014 to 25% in the TTM, while its invested capital turns rose from 0.5 to 0.8 over the same time. Rising NOPAT margins and invested capital turns and drive Allison Transmission’s return on invested capital (ROIC) from 8% in 2014 to 19% in the TTM.
Figure 1: Allison Transmission’s Revenue and NOPAT Since 2014
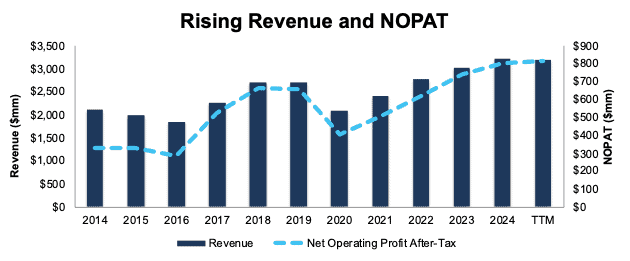
Sources: New Constructs, LLC and company filings
ALSN Is Undervalued
At its current price of $95/share, ALSN has a price-to-economic book value (PEBV) ratio of 0.9. This ratio means the market expects Allison Transmission’s NOPAT to permanently decline by 10% from TTM levels. This expectation seems overly pessimistic for a company that has grown NOPAT by 4% compounded annually over the last five years and 9% compounded annually over the last ten years.
Even if Allison Transmission’s NOPAT margin falls to 22% (equal to five-year average NOPAT margin compared to 26% in the TTM) and the company grows revenue by just 3% (below ten-year CAGR of 4%) compounded annually through 2034, the stock would be worth $127/share today – a 34% upside. In this scenario, Allison Transmission’s NOPAT would grow just 2% compounded annually through 2034. Contact us for the math behind this reverse DCF scenario.
Should Allison Transmission grow profits more in line with historical levels, the stock has even more upside.
Critical Details Found in Financial Filings by Our Robo-Analyst Technology
Below are specifics on the adjustments we made based on Robo-Analyst findings in Allison Transmission’s 10-K and 10-Q:
Income Statement: we made just under $150 million in adjustments, with a net effect of removing under $100 million in non-operating expense. Professional members can see all adjustments made to the company’s income statement on the GAAP Reconciliation tab on the Ratings page on our website.
Balance Sheet: we made over $2 billion in adjustments to calculate invested capital with a net decrease of over $600 million. One of the most notable adjustments was for deferred tax assets. Professional members can see all adjustments made to the company’s balance sheet on the GAAP Reconciliation tab on the Ratings page on our website.
Valuation: we made under $4 billion in adjustments to shareholder value, with a net decrease of over $2 billion. Apart from total debt, the most notable adjustment was for excess cash. Professional members can see all adjustments to the company’s valuation on the GAAP Reconciliation tab on the Ratings page on our website.
This article was originally published on July 11, 2025.
Disclosure: David Trainer, Kyle Guske II, and Hakan Salt receive no compensation to write about any specific stock, style, or theme.
Questions on this report or others? Join our online community and connect with us directly.