
According to market cap as a percent of M2 money supply, U.S. stock markets look more overvalued than ever. It’s hard to see how the market climbs much higher from here. Now is the time to be discerning in capital allocation decisions.
Recent years have highlighted how quickly speculative names, such as meme stocks, can surge before experiencing sharp reversals. It is not just possible, but increasingly likely, that other overextended stocks could face similar corrections.
Our Danger Zone research identifies these landmine stocks so you can avoid them with confidence.
This week’s Danger Zone pick is a company that’s selling off assets to keep its business alive, while the stock price implies an improbably profitable future.
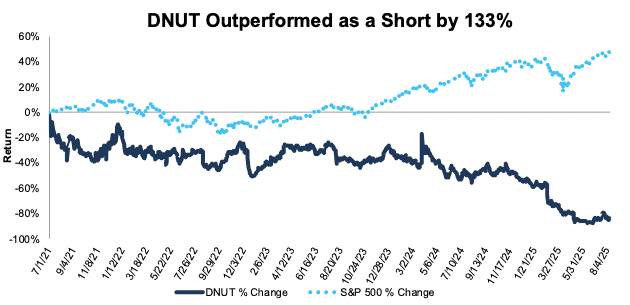
We first put Krispy Kreme Inc. (DNUT: $3/share) in the Danger Zone before its IPO in June 2021 and recently reiterated our bearish opinion on the stock in June 2024. Since the IPO, DNUT is down 83% while the S&P 500 is up 49%.
Just before 2Q25 earnings season kicked off, markets were abuzz with the latest round of meme stock mania. This time around, the chosen stocks were coined the “DORKs”, a play on the first letter of each company’s ticker: Krispy Kreme (DNUT), Opendoor Technologies (OPEN), Rocket Companies (RKT), and Kohl’s (KSS).
While the meme rally was short-lived, especially for Krispy Kreme’s stock, now is the perfect time to remind investors that DNUT remains significantly overvalued.
Krispy Kreme’s stock could fall further based on:
- declining revenue and profits,
- persistently high expenses,
- profitability below peers,
- falling economic earnings and weak balance sheet, and
- a stock valuation that implies Krispy Kreme will double its margins while also growing revenue at dramatic rates.
Figure 1: Krispy Kreme Outperformance as a Short From 7/1/21 Through 8/15/24
Sources: New Constructs, LLC
What’s Working
Krispy Kreme grew the number of global points of access, locations where consumers can purchase Krispy Kreme products, from nearly 6,000 in 2019 to nearly 16,000 in 2Q24 and to just over 18,000 in 2Q25.
What’s Not Working
Even with the strong expansion noted above, the positives largely stop there. The company missed on both the top-and bottom-line in 2Q25 and its revenue and profits are headed the wrong direction, as we’ll show below.
Growth Has Stopped
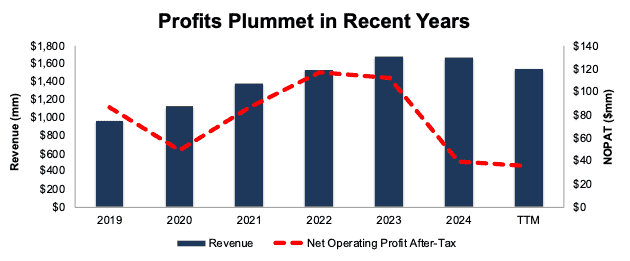
Krispy Kreme’s revenue fell year-over-year (YoY) in 2024 and in the trailing-twelve-months (TTM) ended 2Q25. After peaking at $1.7 billion in 2023, revenue sits at $1.5 billion in the TTM.
This worrisome trend continues to the company’s bottom-line, where Krispy Kreme’s net operating profit after tax (NOPAT) has fallen from $117 million in 2022 to $36 million in the TTM.
Krispy Kreme’s NOPAT margin fell from 9% in 2019 to 2% in the TTM, while the company’s invested capital turns rose from 0.3 to 0.5 over the same time. Rising invested capital turns aren’t enough to offset falling NOPAT margins, which drive the company’s return on invested capital (ROIC) from 3% in 2019 to 1% in the TTM.
Following the same trend, the company’s Core Earnings, a proven superior earnings measure that excludes unusual gains/losses, fell from $47 million in 2022 to -$34 million in the TTM.
Figure 2: Krispy Kreme’s Revenue & NOPAT: 2019 – TTM
Sources: New Constructs, LLC and company filings
Expenses Trending Higher Too
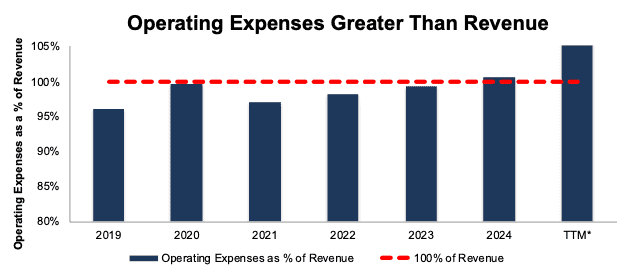
Krispy Kreme’s profits are declining rapidly because of persistently high expenses. In fact, the company’s total operating expenses as a percentage of revenue increased in recent years.
Krispy Kreme’s total operating expenses, which include product and distribution costs, operating expense, selling, general, and administrative expense, marketing expense, pre-opening costs, other expenses, and depreciation and amortization expense increased from 96% of revenue in 2019 to 101% of revenue in 2024 and to 105% of revenue in the TTM ended 2Q25. See Figure 3.
Figure 3: Krispy Kreme’s Expenses as % of Revenue: 2019 – TTM
Sources: New Constructs, LLC and company filings
*Excludes $407 million in reported goodwill and asset impairment for comparability with prior years
Less Profitable Compared to Peers
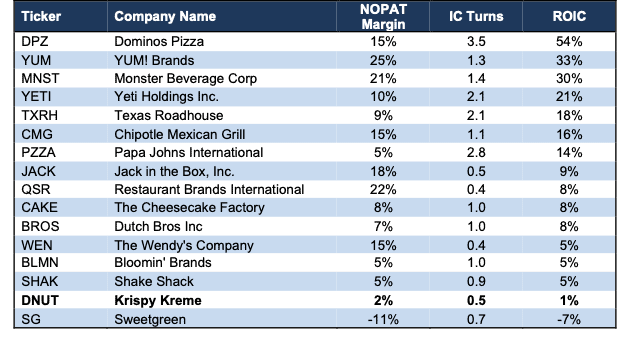
Krispy Kreme consistently lags peers in profitability, too. While the donuts may be tasty, the financials of running the business are not. In fact, Krispy Kreme’s ROIC and NOPAT margin are lower than all the peers listed in its peer group in the company’s proxy statement, except for Zombie Stock Sweetgreen (SG). Similarly, its invested capital turns also rank near the bottom of the group, per Figure 4.
Figure 4: Krispy Kreme Profitability Vs. Peer Group: TTM
Sources: New Constructs, LLC and company filings
Misleading Cash Flow and Falling Economic Earnings
Krispy Kreme’s free cash flow (FCF) was positive in both 2024 and the TTM, after three years of negative FCF. However, positive FCF isn’t a result of growing profits or improving operations, but from selling off assets.
Krispy Kreme’s invested capital fell $293 million YoY in 2024 and $193 million YoY in the TTM ended 2Q25. The company’s total adjusted fixed assets fell by $291 million and $191 million YoY in 2024 and the TTM ended 2Q25, respectively. In other words, nearly all the decline in invested capital is attributable to the company selling off assets, which drove positive FCF in those periods.
Selling off assets cannot sustain a business like Krispy Kreme, which is one of the many reasons this stock could fall all the way to $0/share. We note that Krispy Kreme doesn’t qualify as a Zombie Stock due to its, albeit barely, positive interest coverage ratio and FCF.
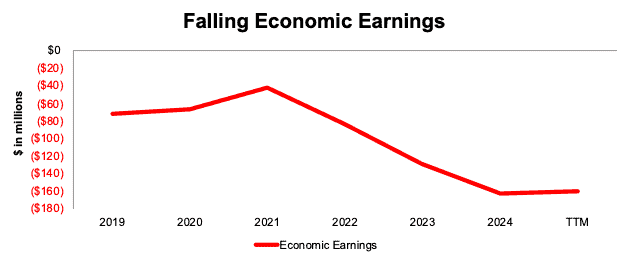
Additionally, Krispy Kreme hasn’t generated positive economic earnings, the true cash flows of the business, in any annual or quarterly period in our company model, which dates back to 2019. Economic Earnings capture changes to the balance sheet, the income statement, and footnotes. In Krispy Kreme’s case, economic earnings paint a more realistic picture of the company’s cash flows.
The company’s economic earnings fell from -$71 million in 2019 to -$161 million in the TTM. See Figure 5.
Figure 5: Krispy Kreme’s Economic Earnings: 2019 – TTM
Sources: New Constructs, LLC and company filings
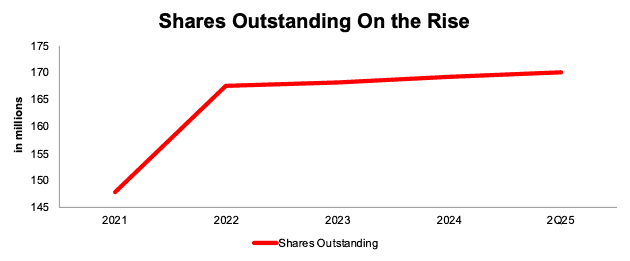
Diluting Shareholders, Too
Krispy Kreme’s shares outstanding increased YoY every year since 2021. Per Figure 6, Krispy Kreme’s shares outstanding increased from 148 million in 2021 to 170 million in 2Q25.
Figure 6: Krispy Kreme’s Shares Outstanding: 2021 – 2Q25
Sources: New Constructs, LLC and company filings
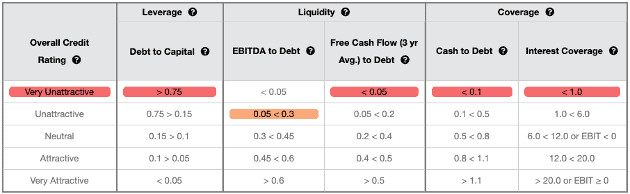
Poor Credit Rating
Krispy Kreme earns a Very Unattractive overall Credit Rating, with an Unattractive-or-worse rating in each of the five metrics that drive our Credit Ratings. The company’s total debt increased from $1.4 billion in 2021 to $1.8 billion in the TTM ended 2Q25, and it has no excess cash. Should economic conditions deteriorate, the company’s weak financial footing could further put its operations at risk.
Figure 7: Krispy Kreme’s Credit Rating Details
Sources: New Constructs, LLC and company filings
Headlines Don’t Generate Profits
Krispy Kreme is struggling to grow due to its high expenses and poor balance sheet as we mentioned earlier. The company’s operations are struggling so much so that it’s had to pull back on previous deals that it hoped would boost its growth and expansion.
In our previous report, we highlighted a deal between Krispy Kreme and McDonalds, in which Krispy Kreme provided fresh doughnuts daily at McDonald’s restaurants nationwide. The company hoped to leverage McDonalds’ vast distribution density to grow its points of access and in turn its product sales.
Flash forward to June 2025, and the deal hasn’t played out as management hoped, as we warned was a risk in our original report. The two companies announced the end to their partnership. Krispy Kreme CEO Charlesworth explained the partnership was terminated because “efforts to bring our costs in line with unit demand were unsuccessful, making the partnership unsustainable for us.”
Another mentionable action Krispy Kreme took to de-leverage its balance-sheet and cut costs was to sell off Insomnia Cookies, which the company acquired back in 2018. Krispy Kreme sold majority ownership in July 2024, and sold its remaining ownership stake in June 2025, completely exiting the Insomnia Cookies business.
Together, these two events underscore the extent of Krispy Kreme’s ongoing challenges in achieving sustainable profitability and growth.
The company faces a strategic trade-off: cost reductions may improve profitability but could limit growth potential, while prioritizing growth risks further eroding margins. At its current stage, executing both initiatives effectively and simultaneously presents a significant challenge for Krispy Kreme.
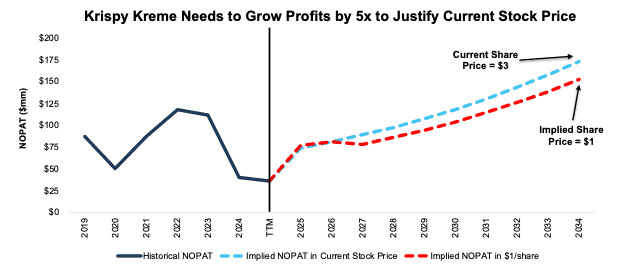
Current Stock Price Implies Profits Will Grow by 5x
Below, we use our reverse discounted cash flow (DCF) model to analyze the future cash flow expectations baked into Krispy Kreme’s stock price. We also present an additional DCF scenario to highlight the downside risk in the stock if Krispy Kreme fails to achieve these overly optimistic expectations.
To justify its current price of $3/share, our model shows that Krispy Kreme would have to:
- immediately improve NOPAT margin to 4% (double Krispy Kreme’s TTM NOPAT margin of 2%) and
- grow revenue 10% (above consensus growth rates of -8% in 2025, 5% in 2026, and -3% in 2027) compounded annually through 2034.
In this scenario, Krispy Kreme’s revenue would reach $4.3 billion in 2034, which is nearly 3x its TTM revenue. This scenario also implies Krispy Kreme would generate $173 million in NOPAT in 2034 which is nearly 5x its TTM NOPAT and 1.5x the company’s highest ever NOPAT of $117 million in 2022. Contact us for the math behind this reverse DCF scenario.
In this scenario, Krispy Kreme’s NOPAT would grow 16% compounded annually. For context, the company’s NOPAT declined 15% compounded annually since 2019.
There’s 70%+ Downside if Growth is In-Line with Industry Expectations
Instead, if we assume Krispy Kreme:
- immediately improves NOPAT margin to 5% (above the company’s TTM NOPAT margin of 2%) and
- revenue grows at consensus estimates in 2025 (-8%), 2026 (5%), and 2027 (-3%), and then
- revenue grows 10% compounded annually through 2034, then
the stock would be worth just $1/share today – a 71% downside to the current price.
This scenario implies that Krispy Kreme generates $3.0 billion in revenue in 2034, which is 2x its TTM revenue. This scenario also implies Krispy Kreme would generate $152 million in NOPAT in 2034 which is still above the company’s highest ever NOPAT of $117 million in 2022. Contact us for the math behind this reverse DCF scenario.
In other words, to even justify $1/share, the company would have to double its revenue while also growing profits above record levels at the same time.
Figure 8 compares Krispy Kreme’s implied future NOPAT in these scenarios to its historical NOPAT.
Figure 8: Krispy Kreme’s Historical and Implied NOPAT: DCF Valuation Scenarios
Sources: New Constructs, LLC and company filings
Stock is Still Not Worth $1
Each of the above scenarios assume Krispy Kreme grows revenue, NOPAT, and FCF without increasing working capital or fixed assets. This assumption is highly unlikely but allows us to create best-case scenarios that demonstrate the high level of expectations embedded in the current valuation. For reference, Krispy Kreme’s invested capital has grown 2% compounded annually since 2019. If we assume Krispy Kreme’s invested capital increases at a similar rate in the DCF scenarios above, the downside risk is even larger.
Given that the performance required to justify its current price is overly optimistic, we dig deeper to see if Krispy Kreme is worth buying at any price. The answer is no.
The company has $1.8 billion in total debt, $25 million in minority interests, $98 million in deferred tax liabilities, and no excess cash. Krispy Kreme has an economic book value, or no growth value, of -$8/share. In other words we do not think equity investors will ever see $1 of economic earnings under normal operations, which means the stock would be worth $0 today.
This article was originally published on August 18, 2025.
Disclosure: David Trainer, Kyle Guske II, and Hakan Salt receive no compensation to write about any specific stock, sector, style, or theme.
Questions on this report or others? Join our Society of Intelligent Investors and connect with us directly.