We published an update on this Danger Zone pick on June 24, 2024. A copy of the associated report is here.
Krispy Kreme Inc. (DNUT: $22.50/share midpoint of IPO price range) is expected to go public for the second time on July 1, 2021. At the midpoint of its IPO price range, Krispy Kreme is valued at roughly $3.6 billion and earns our Unattractive rating.
Krispy Kreme’s expected valuation of $3.6 billion is overpriced and leaves little upside for investors who may be looking to add this stock to their portfolios.
We think the stock is worth no more than $1.6 billion, which is slightly higher than the $1.35 billion JAB Holdings paid to take Krispy Kreme private in 2016. With this IPO, we believe JAB Holdings is looking to cash out at the expense of new investors.
A $3.6 billion valuation implies Krispy Kreme will reverse its profit nosedive, grow profits by nearly 700% and make more money than quick-service restaurant (QSR) industry incumbents like The Wendy’s Company (WEN). Such a scenario looks unlikely given the shift in consumer preferences toward healthier foods and the failure of its past growth strategy to achieve the economies of scale needed to operate profitably. Our IPO research aims to provide investors with more reliable fundamental research.
JAB Holdings Turned Profits into Losses
Krispy Kreme, with its own stores, retail distribution, and e-commerce delivery, operates a similar business model to Starbucks (SBUX) and Dunkin’ Brands (DNKN). However, its profits aren’t trending higher, despite robust growth in delivery sales driving 17% year-over-year (YoY) growth in revenue in 2020.
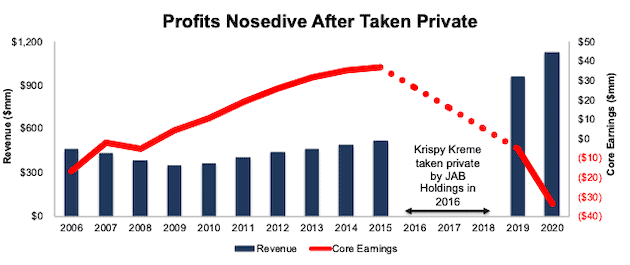
Instead, it appears that JAB Holdings took a once profitable business (Krispy Kreme traded under ticker KKD prior to 2016) private, focused on top-line growth, and ignored profitability. Per Figure 1, Core Earnings[1] grew from -$17 million in 2006 to $37 million in 2015. With the data from Krispy Kreme’s new S-1, we see that Core Earnings declined from -$5 million in 2019 to -$33 million in 2020. In 2015, prior to being acquired, Krispy Kreme earned a 7% return on invested capital (ROIC), which has since declined from 3% in 2019 to 1.8% in 2020.
Figure 1: Krispy Kreme Revenue and Core Earnings: Before and After JAB Holdings Acquisition
Sources: New Constructs, LLC and company filings
Small Share Of a Large Market
Krispy Kreme defines its business as a “sweet treat retailer.” However, more broadly, the firm operates in the QSR industry. In 2020, the QSR industry generated $610 billion in worldwide revenue. Such a large total addressable market, along with an industrywide projected 5% compound annual revenue growth rate through 2026, may have new investors excited about this IPO.
However, the growing demand for quick food and beverages doesn’t mean all QSR firms are on equal footing. With 2020 estimated system wide sales of $1.2 billion[2], Krispy Kreme held only 0.2% market share in 2020, which trails key competitors such as McDonald’s (15.3%) and Starbucks (6.5%).
With little product differentiation, it is unlikely that Krispy Kreme will be able to take market share from larger competitors, especially if cash-rich firms like McDonald’s (MCD) decide to compete more directly with Krispy Kreme by introducing more bakery and breakfast items (as they recently did in October 2020).
Figure 2: Krispy Kreme: Minimal Market Share Amongst QSR Peers (2020)
Sources: New Constructs, LLC and company filings
* Estimate assumes Starbuck licensed locations generate an average of $1.2 million in sales, which equals the average sale of all company-operated stores in 2020
** Estimate assumes Krispy Kreme franchised locations generate an average of $156k in sales, which equals the average sales of all company owned global points of access in 2020
*** Global QSR sales in 2020.
Consumers Want Healthier Options
While the entire QSR industry is large, the world is undergoing a fundamental shift in preference toward healthy, sustainable foods and away from Krispy Kreme’s high-fat and sugar-filled menu.
A 2015 survey by Nielsen found that 49% of global respondents felt they were overweight, 50% said they were trying to lose weight, and 62% of those changing their diet to lose weight said that they were cutting down on sugar. More recently, a 2019 survey by The International Food Information Council Foundation found that 75% of respondents say they are eating healthier now than they were 10 years ago and that consumers are more wary of consuming sugar than any other type of food.
Krispy Kreme, whose staple menu item is its sugary glazed doughnut, has reason to be concerned about the change in consumer preferences. CNBC reports that 42% of American adults gained unwanted weight during the pandemic, which could hurt Krispy Kreme, as well as the rest of the QSR industry, during a time when consumer activity is returning to pre-pandemic levels.
Poor Profitability Makes Taking Market Share Even Less Likely
Krispy Kreme’s self-proclaimed “globally recognized brand with rich history” has not led to a more efficient business than its QSR competitors. Figure 2 shows that Krispy Kreme’s profitability, net operating profit after-tax (NOPAT) margin, and ROIC rank below its QSR peers. The company’s balance sheet efficiency (invested capital turns) also ranks near the bottom of the group.
Figure 3: Krispy Kreme’s Profitability Vs. Competition: TTM
Sources: New Constructs, LLC and company filings
Growth Strategy Hasn’t Improved Efficiency
Since being taken private in 2016, Krispy Kreme has focused on growing sales and “global points of access”, or all locations at which Krispy Kreme doughnuts or cookies could be purchased. If top-line growth and scale are all that matter, one could argue Krispy Kreme’s strategy has succeeded. Krispy Kreme has grown global points of access from 5,926 in 2018 to 9,077 in fiscal 1Q21.
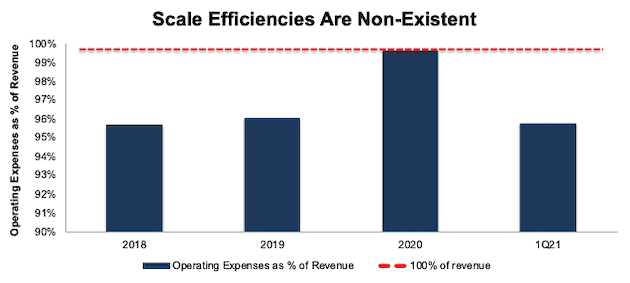
However, this growth strategy appears to be more of a “grow-at-all-costs” strategy and hasn’t come with the economies of scale necessary to lead the firm to sustainable profitability. Expenses, which include product and distribution costs, operating expense, selling, general, and administrative expense, pre-opening costs, other expenses, and depreciation and amortization expense, increased from 95.6% of revenue in 2018 to 99.6% of revenue in 2020. In fiscal 1Q21, expenses remain 95.7% of revenue.
Figure 4: Krispy Kreme’s Expenses as % of Revenue: 2018-1Q21
Sources: New Constructs, LLC and company filings
With no profits to show for this growth strategy, JAB Holding Company, the firm that took Krispy Kreme private in 2016, is now looking to offload risk and paydown debt via the IPO.
Limited Stupid Money Acquisition Risk
Given the fact that Krispy Kreme was already taken private in 2016, it would seem unlikely another acquirer would jump in now that the firm is looking at another IPO. Any potential acquirer could have negotiated a deal directly with JAB Holding Company, rather than paying a public market premium and dealing with new shareholder approval.
Priced to be More Profitable Than Wendy’s
Below we use our reverse discounted cash flow (DCF) model to analyze the future cash flow expectations baked into the midpoint of Krispy Kreme’s IPO price range. Risk/reward at the midpoint IPO price is unattractive.
In order to justify the midpoint IPO price of $22.50/share, Krispy Kreme must:
- achieve an 8% NOPAT margin (equal to 2019, compared to 4% in 2020, and below more profitable peers in Figure 3, which benefit from a more franchise-based business model) and
- grow revenue by 13% compounded annually through 2030, which is nearly 3x the projected industry growth rate through 2026
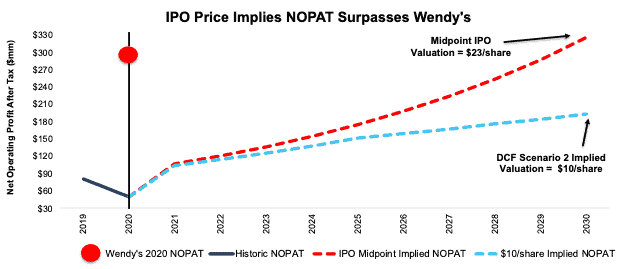
In this scenario, Krispy Kreme would generate $3.9 billion in revenue in 2030, which is nearly 3.5x its 2020 revenue and more than double Wendy’s 2020 revenue. At $3.9 billion in sales, Krispy Kreme’s implied market share would double from 0.2% in 2020 to 0.4% in 2030[3]. Additionally, Krispy Kreme would generate $326 million in NOPAT in 2030, which is nearly 7x its 2020 NOPAT and 116% of Wendy’s 2020 NOPAT.
DCF Scenario 2: Growth Is More In-Line with Industry Expectations
We review an additional DCF scenario to highlight the downside risk should Krispy Kreme’s revenue growth fall more in-line with industry expectations.
If we assume Krispy Kreme:
- achieves pre-pandemic NOPAT margin of 8% and
- grows revenue by 10% compounded annually from 2021-2025 (double projected industry growth rates through 2026) and
- grows revenue 5% compounded annually from 2026-2030 (equal to projected industry growth rates through 2026), then
DNUT is worth just $10/share today – a 56% downside to the midpoint IPO price range. See the math behind this reverse DCF scenario.
Figure 5 compares the firm’s implied future NOPAT in these two scenarios to its historical NOPAT, along with the NOPAT of Wendy’s.
Figure 5: IPO Valuation Is Too High
Sources: New Constructs, LLC and company filings
Each of the above scenarios also assumes Krispy Kreme grows revenue, NOPAT, and FCF without increasing working capital or fixed assets. This assumption is highly unlikely but allows us to create best-case scenarios that demonstrate the level of expectations embedded in the current valuation. For reference, Krispy Kreme’s invested capital increased $32 million (3% of revenue) YoY in 2020. If we assume Krispy Kreme’s invested capital increased at a similar rate in DCF scenario 2 above, the downside risk is even larger.
Red Flags Investors Need To Know About
With a lofty valuation that implies significant improvement in both revenue and profits, investors should be aware that Krispy Kreme’s S-1 also includes these other red flags.
Your Vote Is Overruled. While Krispy Kreme is foregoing the common IPO practice of issuing multiple share classes of its common stock, private investors will still maintain control over the company. Upon completion of the IPO, new investors will hold 16.6% of the voting power, while existing owners will continue to own 83.4% of the voting power in the firm. JAB Holding Company alone will “beneficially own” 77.6% of the voting power in Krispy Kreme.
In other words, despite new investors paying a premium to buy the IPO, Krispy Kreme’s existing owners will continue to control the company, and new shareholders have no control over corporate governance.
If At First You Don’t Succeed, Try Again: Krispy Kreme originally went public in 2000 and operated as a public entity until mid-2016, when the firm was taken private by JAB Holding Company for $1.4 billion. At the time, Krispy Kreme’s fiscal 2015 Core Earnings were $37 million. Five years later, Krispy Kreme’s Core Earnings have fallen to -$33 million.
In other words, JAB Holdings wants to sell Krispy Kreme for 3x what they paid, despite profits falling from $37 million to -$33 million. We see this IPO as a means for JAB Holdings to cash out and transfer risk instead of a great opportunity for new investors. Only in the current market would we expect to see private equity investors attempt to generate out-sized gains after making a business worse.
Adjusted EBITDA Distorts Earnings
Many unprofitable companies present non-GAAP metrics to appear more profitable than they really are, and Krispy Kreme is no different, Krispy Kreme presents the popular Adjusted EBITDA metric as a key performance indicator. Not surprisingly, Adjusted EBITDA gives a more bullish picture of the firm’s business than GAAP net income and our Core Earnings.
For instance, Krispy Kreme’s 2020 adjusted EBITDA removes $21 million in “strategic initiatives” costs, $13 million in acquisition and integration expenses, and $12 million in share-based compensation. After removing all items, Krispy Kreme reports adjusted EBITDA of $145 million in 2020. Meanwhile, economic earnings, the true cash flows of the business, are significantly lower at -$91 million. While Krispy Kreme’s adjusted EBITDA follows the same trend in economic earnings over the past two years, investors need to be aware that there is always a risk that adjusted EBITA could be used to manipulate earnings going forward.
We Don’t Know If We Can Trust the Financials: The SEC does not require Krispy Kreme to have an independent auditor provide an opinion on internal controls until its second annual filing following its IPO. Krispy Kreme discloses in its S-1 that it has not yet conducted a review of its internal controls for the purpose of providing the reports required under SEC rules.
Since the company’s internal controls have not been audited by an independent third party, it cannot be guaranteed that the company’s financial statements or internal calculations are accurate.
Critical Details Found in Financial Filings By Our Robo-Analyst Technology
Fact: we provide superior fundamental data and earnings models – unrivaled in the world.
Proof: Core Earnings: New Data and Evidence, published in The Journal of Financial Economics.
Below are specifics on the adjustments we make based on Robo-Analyst findings in Krispy Kreme’s S-1:
Income Statement: we made $125 million in adjustments, with a net effect of removing $113 million in non-operating expense (10% of revenue). You can see all the adjustments made to Krispy Kreme’s income statement here.
Balance Sheet: we made $226 million in adjustments to calculate invested capital with a net increase of $225 million. The most notable adjustment was $73 million in operating leases. This adjustment represented 3% of reported net assets. You can see all the adjustments made to Krispy Kreme’s balance sheet here.
Valuation: we made $2 billion in adjustments, all of which decreased shareholder value. Apart from total debt, the largest adjustment to shareholder value was $164 million in minority interests. This adjustment represents 4% of Krispy Kreme’s valuation at the midpoint of its IPO price range. You can see all the adjustments made to Krispy Kreme’s valuation here.
This article originally published on June 25, 2021.
Disclosure: David Trainer, Kyle Guske II, Alex Sword, and Matt Shuler receive no compensation to write about any specific stock, style, or theme.
Follow us on Twitter, Facebook, LinkedIn, and StockTwits for real-time alerts on all our research.
[1] Only Core Earnings enable investors to overcome the flaws in legacy fundamental research, as proven in The Journal of Financial Economics.
[2] Estimate assumes Krispy Kreme franchise locations generate an average of $156k in sales, which equals the average sales of all company owned global points of access in 2020
[3] Implied market share assumes the QSR industry grows 5% compounded annually from 2021-2026, as projected by Market Data Forecast, and then that 5% CAGR continues from 2027-2030.


