
The market’s wild swings beg the question: what drives stock prices? The one answer that investors can count on when markets get tough is cash. The market awards the most value to the companies that give the most back. It punishes those that do not create value. Figure 1 shows how well our Danger Zone picks have done.
Figure 1: Danger Zone Stocks Performance Since Publishing Date
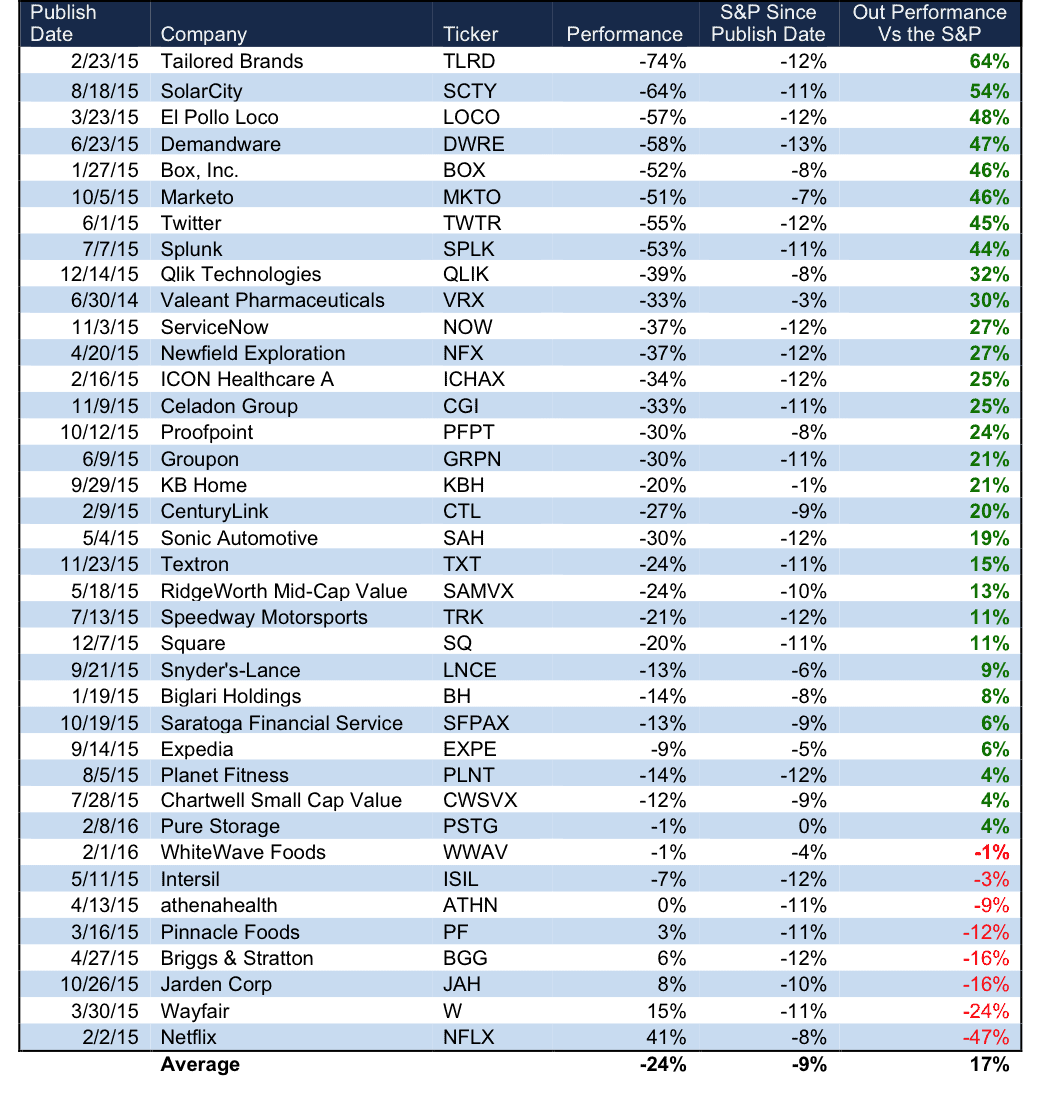
Sources: New Constructs, LLC and company filings
The results of our Danger Zone reports since speak for themselves and highlight the merit of true fundamental research. Of the 38 stocks or mutual funds from Figure 1, 30 have outperformed the market since publish date and 32 out of 38 have negative returns since publish date. The average return of all stocks is -24% compared to -9% for the market.
In these reports, we look past the traditional reported numbers to derive the true recurring profits (or losses) of the business. Only then are we able to identify overvalued companies and alert clients that a ticking time bomb may be in their portfolio. Given the current market environment, we felt it necessary to update the price targets of a few companies placed in the Danger Zone. Despite some already drastic underperformance, these stocks remain in the Danger Zone. They are still significantly overvalued and present great downside risk.
- Qlik Technologies (QLIK)
We put Qlik Technologies in the Danger Zone in December 2015. Since then, QLIK is down 37% while the S&P 500 is down only 8%. In our report, we highlighted multiple problems with Qlik’s stock, which included:
- Deteriorating margins
- More profitable competition
- A flawed bull case propping up shares
- An astronomical valuation
Figure 2 highlights the biggest issue with Qlik. As competition has entered the market, Qlik’s competitive advantages have disappeared. Qlik’s net operating profit after-tax (NOPAT) margins have declined from 9% in 2010 to -1% over the last twelve months. Compounding this issue, Qlik’s return on invested capital (ROIC) has fallen from 48% to -5% over this same time.
Figure 2: Qlik’s Business Model Is Failing
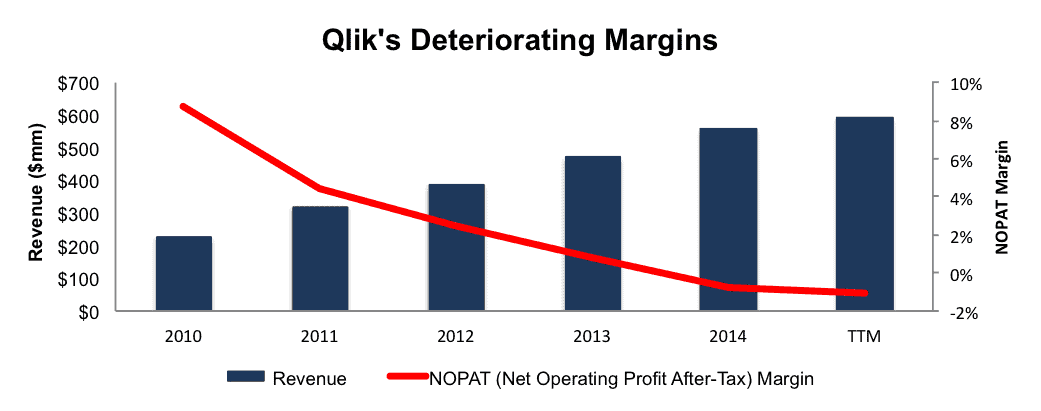
Sources: New Constructs, LLC and company filings
Catalyst for QLIK Has Yet To Occur
Worst of all for investors in QLIK, shares have fallen so drastically without any particular catalyst, but rather the market’s overall awakening to poor fundamentals. When QLIK reports 4Q15 results, slowing growth in licensing revenue could push shares even lower.
Despite Decline, QLIK Still Overvalued
After falling nearly 40%, one might think that QLIK has “gone on sale.” Not even close. Shares still remain significantly overvalued. To justify its current price of $19/share, Qlik must immediately achieve and maintain 5% pre-tax margins (its average since 2010) and grow revenue by 25% compounded annually for the next 13 years. Those are awfully high expectations for any stock. Too high.
Even if we assume something a bit more reasonable (though still pretty darn aggressive), QLIK has large downside risk. If QLIK can achieve pre-tax margins of 5% and grow revenue by 10% compounded annually for the next decade, the stock is worth only $6/share today – a 68% downside. Keep in mind that Gartner expects the entire industry to grow around 9% per year. We think it is clear just how much downside risk is in QLIK.
- Square, Inc. (SQ)
We put Square in the Danger Zone in December 2015. Since then, SQ is down 29% while the S&P 500 is down only 10%. In our report, we highlighted multiple problems with Square business, which included:
- Lack of profit throughout its existence
- Use of misleading non-GAAP metrics
- Strong, entrenched competition
- A flawed business model
- An unrealistic valuation
Figure 3 showcases the uphill battle Square faces. With a -33% ROIC, Square’s lack of profitability gives it zero pricing power and little flexibility. Those payment providers already entrenched in the market have built businesses serving clients that generate cash flows to sustain and grow their businesses. Square’s valuation implies it can supplant these incumbents. The only alternative is to serve small merchants that their competitors have chosen to ignore due to low profitability.
Figure 3: Square’s Competitors Are Far More Profitable
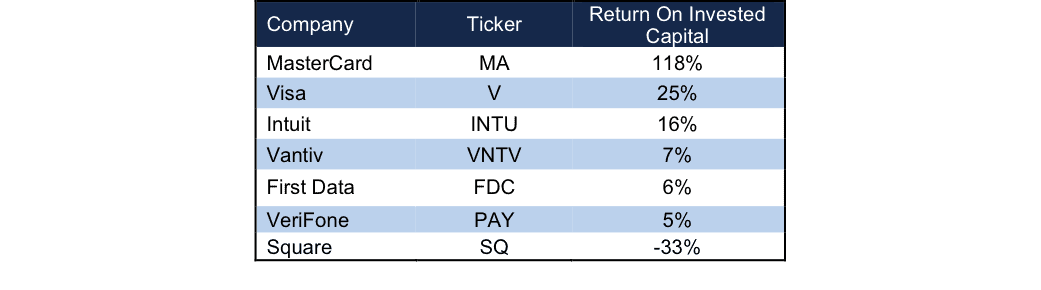
Sources: New Constructs, LLC and company filings
Square’s Misleading Non-GAAP Metrics Attempt To Hide Problems
Like many unprofitable IPO companies, Square wants investors to focus on any one of its non-GAAP metrics such as adjusted EBITDA, gross payment volume, or adjusted revenue. Each of these metrics removes key costs of business such as stock based compensation and interchange fees that Square must pay card issuers. Worst of all, Square isn’t able to report a profit even after the removal of these operating costs.
SQ Remains Overvalued
Square was able to finish its IPO before the market headed in a downward spiral. Even though Square priced well below its IPO range, shares were overvalued at the time and remains overvalued. In order to justify its current price of $9/share, Square must immediately achieve pre-tax margins of 9% (-14% in 2014) and grow revenue by 20% compounded annually for 12 years. In this scenario, Square would be generating over $7.5 billion in revenue in 12 years, which is greater than INTU, VNTV, FDC, and PAY’s last fiscal year revenue.
Even if we look at a more reasonable scenario, in which Square achieves limited profitability, but maintains a elevated revenue growth rate due to its smaller size, the stock still has significant downside risk. If Square can achieve pre-tax margins of 5% and grow revenue by 10% compounded annually for the next decade, the stock is worth less than $1/share today – a nearly 99% downside. Without the upheaval of market incumbents and significant margin expansion, Square’s business could be worth $0. Always remember, just because a business offers a good product for its consumers (connecting small merchants to credit card commerce), it is not good for public market equity investors.
- Twitter, Inc. (TWTR)
We put Twitter in the Danger Zone in June 2015. Since then, TWTR is down 59% while the S&P 500 is down only 12%. Our report was among the first to identify the fatal flaw in Twitter’s business model:
“The best interests of the users (i.e. quick, easy access to the content of their choosing) are not aligned with the best interests of advertisers (i.e. getting more attention of users not necessarily looking for them).”
We also highlighted other issues:
- Negative profits that are getting worse
- Small user base compared to competitors
- Slowing user growth
- Greatly overvalued stock price
The main issues for which we see no answer is that the path to profitability puts the company in a catch 22, to become profitable, Twitter must alienate its users or to grow users, Twitter must alienate its advertisers. With this flaw in mind, it should come as no surprise then that since 2012, Twitter’s after-tax profit (NOPAT) has declined from -$44 million to -$490 million. Figure 4 has the details.
Figure 4: Twitter’s Business Model Lacks Profits
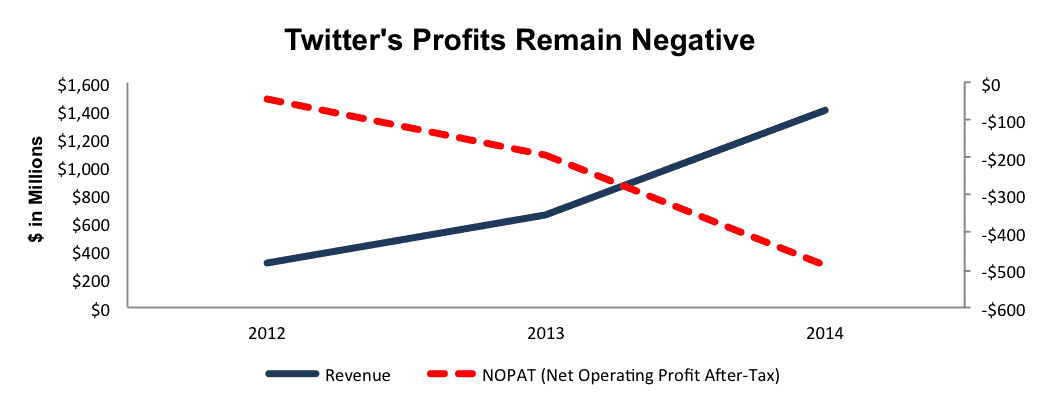
Sources: New Constructs, LLC and company filings
2016 Has Provided No Relief
So far through 2016, Twitter has failed to address any bear concerns surrounding the stock. Twitter has announced that four senior executives will be leaving the company in addition to the head of Vine departing for Google. These executive changes come right on the heels of the CEO change that occurred in 2015. Compounding the issues, when Twitter reported 4Q15 results on February 10, 2016, the most notable number may have been that monthly active users not only stopped growing, but fell to 305 million, down from 307 million in 3Q15.
Given Concerns, TWTR Still Remains Highly Overvalued
It may seem hard to fathom that after falling nearly 60% since June 2015, but TWTR remains significantly overvalued. In order to justify its current price of $15/share, Twitter must immediately achieve 10% pre-tax margins (compared to -36% in last fiscal year) and grow revenue by 21% compounded annually for 12 years. Expecting this scenario to unfold is highly optimistic for any company, much less one with a broken business model.
Looking at a more reasonable scenario shows just how much further TWTR could fall. If Twitter can achieve pre-tax margins of 5% and grow revenue by 20% compounded annually for the next decade, the stock is worth $3/share today – an 80% downside. Without significant changes to Twitter’s business model, this stock exhibits large downside risk and nearly no upside potential.
- Proofpoint (PFPT)
We put Proofpoint in the Danger Zone in October 2015. Since then, PFPT is down 33% while the S&P 500 is down only 7%. Our report pointed out many problems with Proofpoint, which included:
- Declining operating margins amidst revenue growth
- Operating in a crowded market
- More profitable competitors
- Minimal buyout value
- Overvalued stock price
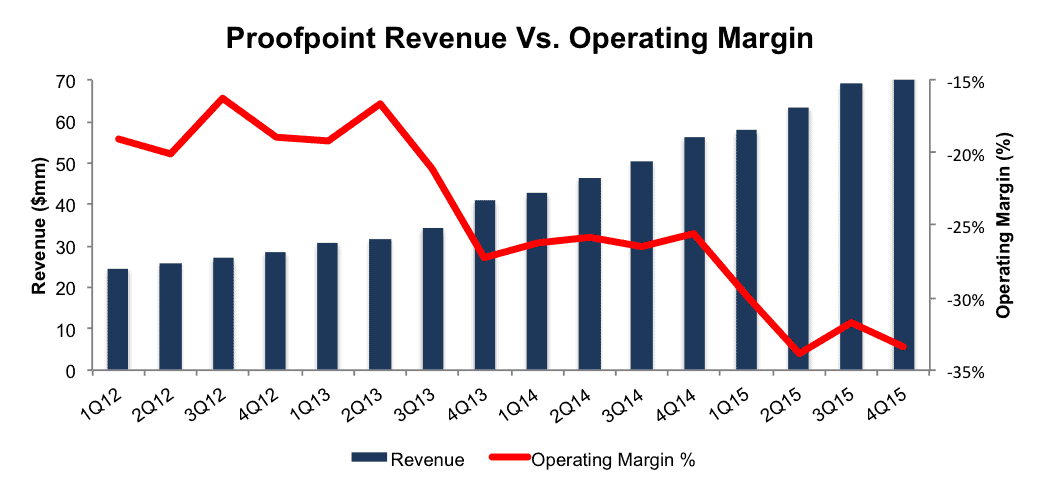
Figure 5 shows that not only is revenue growth slowing, but Proofpoint’s operating margins remain highly negative. Operating margin has fallen from -19% in 1Q12 to -33% in 4Q15. Proofpoint’s after-tax profit (NOPAT) has fallen from -$19 million in 2012 to -$70 million over the last twelve months.
Figure 5: Proofpoint’s Margins Continue To Lag
Sources: New Constructs, LLC and company filings
Ignore Non-GAAP Nonsense
Proofpoint is another company that tries to fool investors with non-GAAP metrics when reporting its results. Despite reporting GAAP net income of -$31 million in 4Q15, Proofpoint reports a positive $573,000 in adjusted EBITDA. How so? Proofpoint removes stock based compensation ($16 million in 4Q15, 22% of revenue), acquisition related expenses, and litigation expenses to help appear profitable when the reality of the business is in stark contrast.
Shares Remain Highly Overvalued
Despite a 33% decline in share price, Proofpoint remains significantly overvalued. In order to justify its current price of $40/share, Proofpoint must immediately achieve pre-tax (NOPBT) margins of 10% (compared to -29% over last twelve months) and grow revenue by 21% compounded annually for the next 22 years. In this scenario, Proofpoint would be generating over $13 billion in revenue in 22 years, which is nearly double one of its main competitors, Symantec’s (SYMC) 2015 revenue.
Looking at a more reasonable (but still aggressive) scenario further highlights the downside risk in PFPT. If Proofpoint can achieve pre-tax margins of 10% and grow revenue by 15% compounded annually for the next decade, the stock is worth $2/share today – a 95% downside. In fact, without significantly higher revenue growth, Proofpoint’s valuation remains negative with any pre-tax margin below 10%. It’s clear how much downside risk still remains in PFPT.
Disclosure: David Trainer and Kyle Guske II receive no compensation to write about any specific stock, sector, or theme.
Click here to download a PDF of this report.
Photo Credit: Ano Lobb (Flickr)