We closed this position on November 16, 2020. A copy of the associated Position Update report is here.
Check out this week’s Danger Zone interview with Chuck Jaffe of Money Life and Marketwatch.com
Recent IPO Square (SQ: $12/share) is in the Danger Zone this week despite its noble cause of providing payment solutions for small to medium businesses because it checks many of the Danger Zone boxes: questionable non-GAAP accounting, non-competitive business models, and an extremely risky valuation.
Ignore Revenue Growth, Look For Profits (Or Lack Thereof)
Investors love IPOs that tout impressive revenue growth, especially in an industry which pundits believe is “ripe for change,” such as the payment processing industry. The risk of focusing on revenue growth is that it does not always mean there are any profits. Square’s revenue growth, 104% compounded annually since 2012, has occurred while generating losses and not any after-tax profit (NOPAT). In fact, NOPAT has fallen from -$80 million in 2013 to -$121 million in 2014. Figure 1 illustrates this disconnect between revenue and profits.
Figure 1: Square’s Revenue Illusion
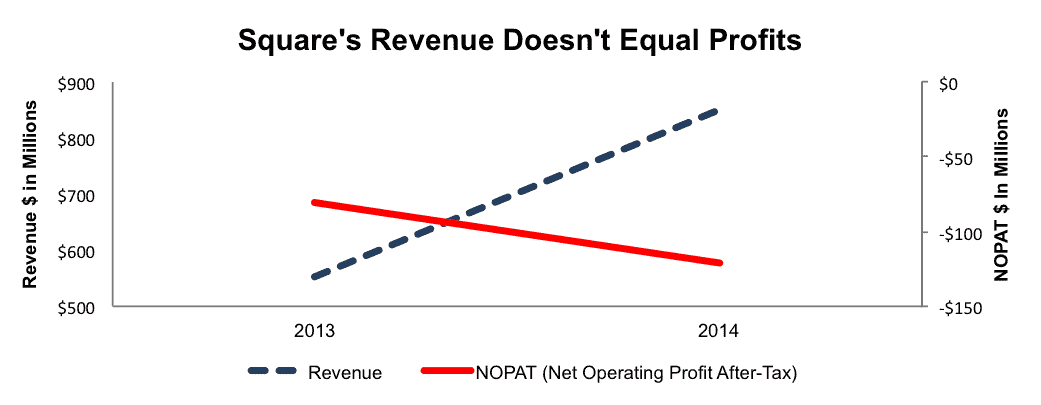
Sources: New Constructs, LLC and company filings
Square’s business model exhibits the same trait we have seen in many cloud based software companies: expenses are growing much faster than revenues. From 2012-2014 the company’s cost of goods sold, product development and sales & marketing costs have risen respectively 119%, 76% and 41% compounded annually.
Furthermore, the capital being deployed into the business has not been done so efficiently as Square’s return on invested capital (ROIC), which was -30% in 2013 , remains a bottom quintile -33% on a trailing twelve month (TTM) basis.
Despite what management would have you believe, expanding the business has been extremely costly and destructive to shareholder value.
Non-GAAP Metrics Are Misleading
We’ve previously highlighted the dangers of non-GAAP earnings, whether it in IPOs or long-standing companies. Unfortunately for investors, Square uses non-GAAP metrics that serve no purpose but to make an unprofitable business look “less unprofitable.” Square uses three different non-GAAP and misleading metrics:
- Adjusted EBITDA. – This metric is what management wants investors to focus on and is actually what Square uses to evaluate operating performance and make strategic decisions. Adjusted EBITDA removes items such as stock based compensation expense (4% of revenue in 2014) and all effects of the Starbucks agreement, which actually costs Square money for each transaction conducted at Starbucks. How convenient for management to focus on a metric that removes the impact of a money losing deal and their own pay.
- Gross Payment Volume (GPV) – represents the total dollar amount of transactions processed by Square and is used to show the large usage of Square’s systems. This metric is similar to Groupon’s gross billings metric, which also created an ephemeral illusion of success. Keep in mind that the unprofitable Starbucks deal boosts GPV while actually lowering profits.
- Adjusted revenue – represents Square’s revenue, excluding the impact of the Starbuck’s agreement and after the removal of interchange fees Square pays card issuers.
Competition Puts a Cap on Growth and Profit Potential
Square faces ample competition in the payment processing industry. In fact, point of sale terminal providers Verifone (PAY) and Ingenico are estimated to have a 49% global market share of the POS terminal market. Additionally Square faces competition from other payment processors like Vantiv (VNTV) and First Data (FDC), who are estimated to have a combined 53% market share of processing volume. We haven’t even mentioned competitors such as PayPal (PYPL), Intuit (INTU), or any number of private startups who also provide mobile payment solutions.
MasterCard (MA) and Visa (V), companies which benefit from Square’s payment terminals, are also building their own mobile payment applications which could encroach upon Square’s turf. MA and V have deep pockets and a large network. All this competition culminates to create an extremely crowded and competitive industry landscape.
Worst of all, as seen in Figure 2, Square is the least profitable of its many competitors, and its not even close. It’s hard to see how SQ can compete in this environment.
Figure 2: Square’s ROIC Creates Competitive Challenges
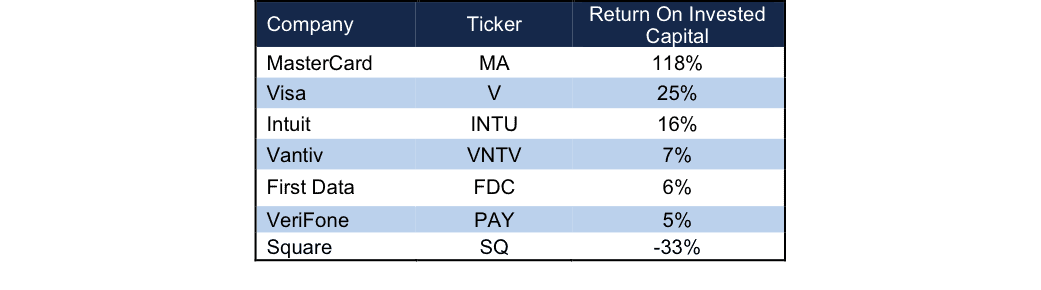
Sources: New Constructs, LLC and company filings
Bull Case Requires A Sticky Business Model
Similar to our insight into Twitter’s flawed business model, another Jack Dorsey creation, Square’s business model has a fatal flaw. The more value it provides to its users via access to the vast world of credit card commerce, the less value it offers stock holders.. The more Square raises the prices it charges users, the smaller its addressable market and the more it may alienate its existing customers and see market share loss. On the other hand, maintaining its low-cost status-quo leaves Square serving the merchants that larger providers deemed too risky, unprofitable, or both, which is currently reflected in Square’s large negative profits. More over, the Starbucks deal is a great example of how unprofitable and unsuccessful dealing with larger customers can be. For Square to gain traction in any larger businesses, it would have to supplant the existing payment system in place, which could entail lowered transaction fees or volume discounts, i.e. Starbucks agreement.
To come close to reaching the heights implied by Square’s valuation, Square must provide something sticky, something that merchants cannot get elsewhere. Unfortunately, we see noting of the sort…that is profitable anyway. Square’s payment terminals are nothing special (they give many of them away), and many other competitors, including PayPal and Intuit have already created their own. Aside from simple payment terminals, the digital and mobile space exists as an avenue for expansion. Unfortunately Square has attempted mobile wallet type applications, competing with Google Wallet, Apple Pay, or any number of mobile applications that allow for payment such as Starbuck’s own mobile app, to no avail. Additionally, Square is still a small player in the digital and mobile payment space. In fact PayPal, which processed nearly $70 billion in payments during 3Q15 alone, dwarfs Square, which processed $25.5 billion in payments through the first nine months of 2015.
Is Square Hoping to Be Acquired?
With so many competitive challenges and little inherent value proposition, some investors must be hoping for a buyout to justify the lofty valuation they have assigned to SQ. While Square’s technology might be easily replicated, one could make the argument that its customer data on spending habits or transaction values could be worth acquiring.
If we assume Vantiv acquires Square and upon acquisition Square immediately achieves Vantiv’s margins and ROIC, the company would still have to grow revenue by 31% compounded annually for the next 25 years to justify buying Square at is current price (~$12/share). A more realistic price for Vantiv to pay is $5.50/share, which is the value of SQ’s business based on the value of the firm if it achieves VNTV’s 12% NOPAT margin in year 1 of the acquisition.
Hidden Liabilities Make Buyout Even More Unlikely
Square has some hidden liabilities that make the company even more expensive than the standard accounting numbers suggest:
- $466 million in outstanding employee stock options (12% of market cap)
- $514 million in preferred stock (13% of market cap)
- $115 million in off balance sheet operating leases (3% of market cap)
In addition to these liabilities, Square has $144 million in debt, which represents 4% of its market cap. While these hidden liabilities detract from the overall value of Square the likeliest competitor to purchase Square would be another payment terminal provider, like in our scenario above. We find it hard to believe another provider would want to serve the unprofitable merchants Square currently serves. Lastly, its unlikely that a card provider such as Visa or MasterCard would acquire Square as it is more beneficial for them to allow Square to take on the risk of providing payment terminals and simply collect the transaction fees once Square sets up the system.
With or Without Acquisition, Valuation Is Unrealistic Given Square’s Operations
Square IPO’d at $9/share, well below the $11-$13 range that was previously indicated and 30% below a private fundraising round just a year ago. Despite the already sinking valuation, investors saw this as a “buy the dip” opportunity and shares now trade at $12/share. To justify the current price, Square must immediately achieve pre-tax margins of 5% (-14% in 2014) and grow revenue by 26% compounded annually for the next 16 years. In this scenario, Square would be generating $32.7 billion in revenue 16 years from now, which is slightly more than all the competitors’ 2014 revenue in Figure 3 combined.
Even if we assume a “best case scenario”, in which Square is able to achieve 9% pre-tax margin (above competitor VeriFone but below Vantiv, which provides more than just payment processing) and can grow revenues by 23% compounded annually for the next decade, the stock is only worth $7/share today – a 42% downside.
Catalyst: Loss of Starbucks A Sign Of Things To Come?
Square entered into an exclusive deal with Starbucks in 2012 and this deal will end on or before 3Q16. In its S-1 Square revealed that this agreement was nothing but a money losing venture. From 2012-2014 Square had gross losses of over $56 million on the deal. However, Starbucks accounted for 14% of revenue in 2014, which makes it a large part of Square’s business. When companies that lack profits go public, investors cling to top line growth as proof the business model is working. With the loss of Starbucks, Square must not only make up this revenue, but find other avenues to grow the top line or risk seeing severe investor backlash in the form of share price tanking. Unfortunately, the market eventually wakes up to the reality that these revenue growth business provide no value to investors and shares adjust downward accordingly. Take for example Box and Demandware two recent high revenue growth stocks that are down 35% and 30% respectively since being put in the Danger Zone.
Also Beware The Venture Capitalist “Cash Out”
Did Square go public because it needed capital? Or did it go public to line the pockets of early/VC investors who are looking for an exit?
Of the 322 million shares outstanding after the IPO, only 27 million shares were part of the IPO. 92% of shares outstanding are locked up for 180 days. After the lock-up expires, IPO buyers could be in trouble as the existing investors cash out and look for the next unicorn. As we noted in this detailed report, IPO investors must beware of the risks presented by investing in IPOs with large insider/venture capital investments.
The lock-up expiration and Square’s dependency on high revenue growth could provide the ultimate 1-2 punch knockout for SQ.
Executive Compensation Provides Little Accountability
Square’s executive compensation is particularly vague. The compensation committee has discretion over all metrics chosen from which to base executive bonuses on. Unfortunately for investors, these metrics include, but are not limited to any number of GAAP and non-GAAP targets such as revenues, EBIT, EBTIDA, adjusted EBITDA, stockholder return, sales bookings, or even ROI, just to name a few. We would prefer to see a more clear-cut compensation plan with specific criteria, one of which should be ROIC as it has been proven to be a driver of shareholder value creation.
Impact of Footnotes Adjustments and Forensic Accounting
We have made several adjustments to Square’s S-1. The adjustments are:
Income Statement: we made $33 million adjustments with a net effect of removing $33 (4% of revenue) million in non-operating expenses. We removed less than $1 million in non-operating income and $33 million in non-operating expenses.
Balance Sheet: we made $217 million of balance sheet adjustments to calculate invested capital with a net increase of $19 million. The largest adjustment was the inclusion of $115 million related to operating leases. This adjustment represented 33% of reported net assets.
Valuation: we made $1.1 billion of shareholder value adjustments with a net effect of decreasing shareholder value by 1.1 billion. The most notable adjustment to shareholder value was the removal of $515 million due to preferred stock. This adjustment represents 13% of Square’s market cap.
Disclosure: David Trainer and Kyle Guske II receive no compensation to write about any specific stock, style, or theme.
Click here to download a PDF of this report.
Photo Credit: Engadget
2 replies to "Danger Zone: Square, Inc. (SQ)"
SQ down 30% so far to begin 2016 and down 26% since being placed in the Danger Zone
SQ falls nearly 20% after Q1 earnings as expenses come in higher than expected and losses widen.