
Check out this week’s Danger Zone interview with Chuck Jaffe of Money Life.
Our research indicates that Large Cap style funds offer some of the most appealing investment options among mutual funds and ETFs. According to our fund rating methodology, roughly 50% of all Large Cap ETFs and mutual funds receive an Attractive-or-better rating while 6% receive a Dangerous-or-worse rating.
A deeper level of diligence remains warranted, however, and reveals that some of these funds are far less appealing than others. This diligence is particularly useful for the Large Cap Growth style, where only 21% of funds receive an Attractive-or-better rating and 8% receive a Dangerous-or-worse rating.
Digging further, we identified a potentially dangerous fund that traditional, backward-looking fund research overlooks. We found this fund by leveraging our Robo-Analyst technology to sift through the holdings of all 2,456 Large Cap style ETFs and mutual funds. We think this sifting is important to fulfilling the Fiduciary Duty of Care.
Touchstone Sands Capital Select Growth Fund (TSNAX, TSNCX, PTSGX, CFSIX) is one of the Large Cap Growth funds investors should avoid. All four classes earn a Dangerous-or-worse rating. TSNAX is the worst of the group and earns a Very Dangerous rating. The fund’s overvalued holdings and high fees diminish the likelihood that the fund’s recent outperformance will continue. Touchstone Sands Capital Select Growth Fund is in the Danger Zone this week.
Holdings Quality Analysis Reveals Poor Allocation vs. Benchmark
The only justification for a mutual fund to charge higher fees than its ETF benchmark is “active” management that leads to out-performance. A fund is most likely to outperform if it has higher quality holdings than its benchmark. To make this determination on holdings quality, we leverage our Robo-Analyst technology to drill down to the individual stock level of every fund.
Figure 1: Touchstone Sands Capital Select Growth (TSNAX) Asset Allocation
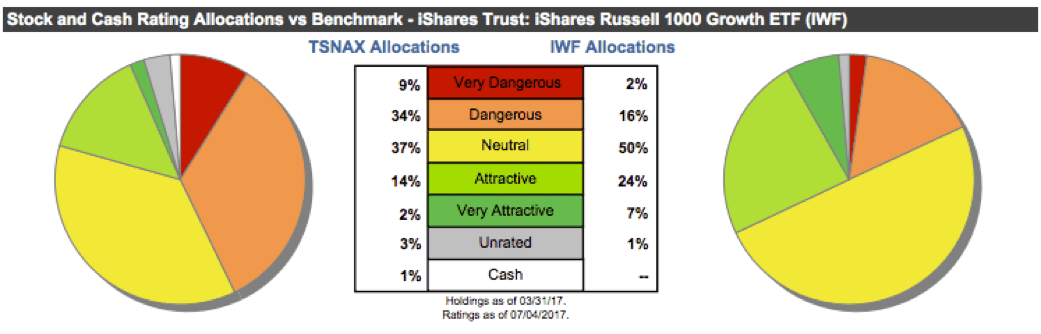
Sources: New Constructs, LLC and company filings
Per Figure 1, Touchstone Sands Capital Select Growth Fund allocates only 16% of its assets to Attractive-or-better rated stocks compared to 31% for the benchmark iShares Russell 1000 Growth ETF (IWF). In addition, exposure to Dangerous-or-worse rated stocks is much higher for Touchstone Sands Capital Select Growth (43% of assets) than for IWF (18% of assets).
Furthermore, eight of the mutual fund’s top 10 holdings receive a Neutral-or-worse rating and make up nearly 46% of its portfolio.
Given the unfavorable distribution of Attractive vs. Dangerous allocations relative to the benchmark, Touchstone Sands Capital Select Growth Fund appears poorly positioned to capture upside potential while minimizing downside risk. Compared to the average mutual fund, Touchstone Sands Capital Select Growth Fund has a much lower chance of generating the outperformance required to justify its fees.
Touchstone Allocates to Overvalued Large Cap Stocks
In Figure 2, the details behind our Predictive Overall Fund rating for TSNAX show the managers of the fund have selected highly overvalued stocks, especially when compared against the overall market (S&P 500). These criteria we use to rate funds are very similar to our Stock Rating Methodology, because the performance of a fund’s holdings equals the performance of a fund.
Figure 2: Touchstone Sands Capital Select Growth (TSNAX) Rating Breakdown
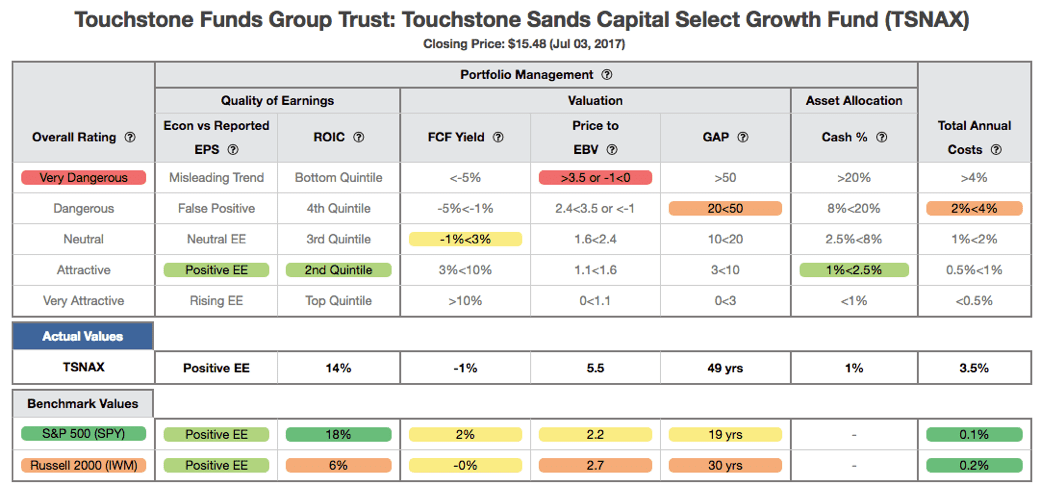
Sources: New Constructs, LLC and company filings
The return on invested capital (ROIC) for TSNAX’s holdings is 14%, which is below the 18% ROIC earned by S&P 500 companies and the 25% earned by companies in the benchmark IWF. Worse, the -1% free cash flow (FCF) yield of TSNAX’s holdings is lower than the S&P 500 (2%) and IWF (2%)
The price to economic book value (PEBV) ratio for the S&P 500 and IWF is 2.2 and 2.5 respectively. Meanwhile, the PEBV ratio for TSNAX is 5.5. This ratio means the market expects TSNAX profits to grow 550% while the profits of companies in the S&P 500 and IWF to grow only 220% and 250% respectively.
Lastly, our discounted cash flow analysis of fund holdings reveals a market implied growth appreciation period (GAP) of 49 years for TSNAX compared to 19 years for the S&P 500 and 22 years for IWF. In other words, companies held by TSNAX have to grow economic earnings for three decades longer than those in the S&P 500 to justify their current stock prices. This expectation seems even more unlikely given that TSNAX holds less profitable firms than the S&P 500, as measured by ROIC.
Ultimately, the high profit growth expectations baked into the valuations of stocks held by TSNAX lowers the upside potential and makes outperformance less likely.
Touchstone Sands’ Fees Make Outperformance More Difficult
At 3.51%, TSNAX’s total annual costs (TAC) are higher than 88% of Large Cap Growth style mutual funds under coverage. Per Figure 3, Touchstone Sands Capital Select Growth’s expense ratios understate the true costs of investing in this fund. For comparison, the average TAC of all Large Cap style mutual funds under coverage is 1.66%, the weighted average is 1.36%, and the benchmark has total annual costs of 0.22%.
Figure 3: Touchstone Sands Capital Select Growth Fund’s Cost Comparison
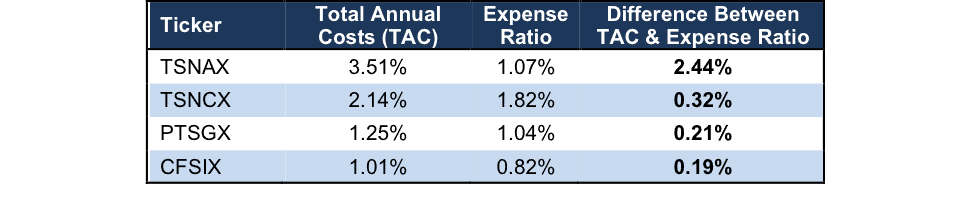
Sources: New Constructs, LLC and company filings
To justify its higher fees, the Touchstone Sands Capital Select Growth Fund must outperform its benchmark (IWF) by the following over three years:
- CFSIX must outperform by an average of 0.78% annually.
- PTSGX must outperform by an average of 1.03% annually.
- TSNCX must outperform by an average of 1.91% annually.
- TSNAX must outperform by an average of 3.28% annually.
An in-depth analysis of TSNAX’s TAC is on page 2 here.
Recent Outperformance Is the Exception, Not the Rule
Over the past year, TSNAX is up 23% while IWF is up 18%. Given that 43% of assets are allocated to stocks with Dangerous-or-worse ratings, the recent price performance is likely to prove difficult to sustain.
Investors looking to buy TSNAX must not only expect the significant profit growth highlighted earlier, but also ignore the fund’s failure to outperform over the long term. Over the past decade, TSNAX is up 108% while, IWF is up 129%. Figure 3 shows the growth of 10k over the past five years for TSNAX, IWF, and SPY.
We think it overly optimistic to invest in the belief that this mutual fund will outperform its much cheaper ETF benchmark over significant time frames given the issues outlined above.
Figure 4: Touchstone Sands Capital Select Growth vs. IWF & SPY
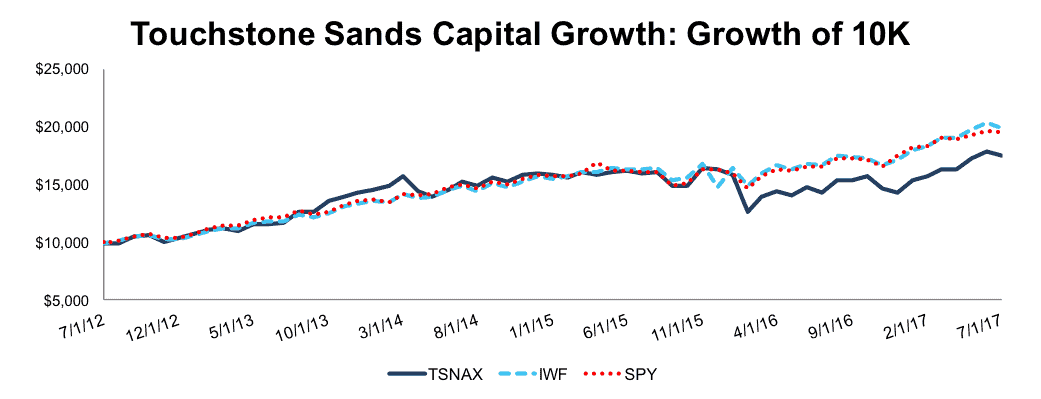
Sources: New Constructs, LLC and company filings.
The Importance of Holdings Based Fund Analysis
There are inherent flaws in backward-looking fund ratings. By focusing on past performance, these ratings systems fail to provide true, forward looking diligence on the risk/reward of investing in any fund. Our ETF & mutual fund ratings provide forward looking diligence by analyzing the risk/reward of the holdings of every fund.
This unique approach to mutual fund analysis shows that investors must be careful when investing in Large Cap style funds. Rather than putting money into TNSAX, investors would be better suited with any of the 1,233 Large Cap style ETFs and mutual funds under coverage that receive an Attractive-or-better rating.
Each quarter we rank the 10 sectors in our Sector Ratings for ETF & Mutual Funds and the 12 investment styles in our Style Ratings For ETFs & Mutual Funds report. This analysis allows us to find funds that investors using traditional fund research may view as quality investments while deeper analysis reveals otherwise, such as Touchstone Sands Capital Select Growth Fund.
This article originally published on July 10, 2017.
Disclosure: David Trainer, Kyle Guske II, and Kenneth James receive no compensation to write about any specific stock, sector, style, or theme.
Follow us on Twitter, Facebook, LinkedIn, and StockTwits for real-time alerts on all our research.
Click here to download a PDF of this report.
Photo Credit: Jim Champion (Flickr)