
This report analyzes[1] market cap, economic book value, and the price-to-economic book value (PEBV) ratio for the NC 2000 and each of its sectors. The PEBV ratio for the NC 2000 and its sectors equals aggregate market cap divided by aggregate economic book value. See Appendix I and II for more details.
The NC 2000 consists of the largest 2000 U.S. companies by market cap in our coverage. Constituents are updated on a quarterly basis (March 31, June 30, September 30, and December 31). We exclude companies that report under IFRS and non-U.S. ADR companies.
We analyze other fundamental and valuation metrics for the NC 2000 and its sectors in these reports:
- Core Earnings for the NC 2000 and each sector: All Cap Analysis: Net Income Understates Core Earnings in 2020
- Return on invested capital (ROIC) and its drivers for the NC 2000 and its sectors: All Cap Analysis: Only One Sector Has a Rising ROIC in 2020
- Free cash flow (FCF) yield and its drivers for the NC 2000 and its sectors: All Cap Analysis: Free Cash Flow Yield Falls in 2020
These reports leverage cutting-edge technology to provide clients with a cleaner and more comprehensive view of every measure of profits[2].
NC 2000 PEBV Ratio Jumps in 3Q20
The PEBV ratio for the NC 2000 rose from 1.2 at the end of 2019 to 1.8 through 11/17/2020 (the earliest date updated 10-Qs for the NC 2000 constituents were available). The NC 2000 PEBV ratio last reached this level in mid-2019, per Figure 1. This ratio compares the NC 2000’s expected future profits (embedded in its equity valuation) to existing profits. At 1.8, the NC 2000’s valuation implies the profits of the NC 2000 stocks will increase 80% from current levels.
Three NC 2000 sectors trade below their economic book value (excluding Energy). More details below.
Figure 1: PEBV Ratio for the NC 2000 From 1998 – 11/17/20
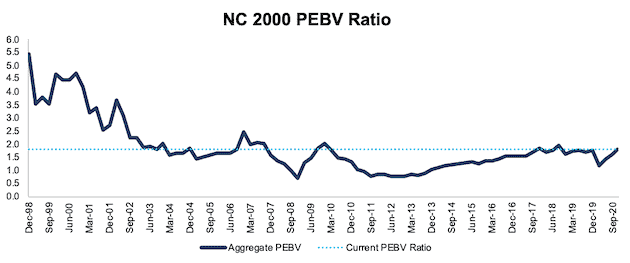
Sources: New Constructs, LLC and company filings.
Ranking All Sectors by Price to Economic Book Value Ratio (PEBV)
Figure 2 shows that Financials sector has the lowest PEBV ratio among all 11 NC 2000 sectors based on TTM data.
Figure 2: PEBV Ratios for all NC 2000 Sectors as of 11/17/20
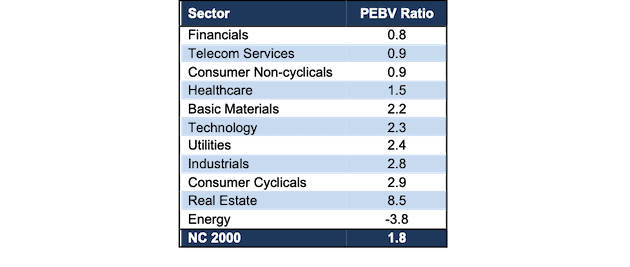
Sources: New Constructs, LLC and company filings.
A PEBV ratio of 0.8 means investors expect the Financials sector’s profits to decline, permanently, by 20% from current levels. On the flip side, investors expect the Real Estate sector (PEBV ratio of 8.5) to improve profits more than any other NC 2000 sector.
Details on Each of the NC 2000 Sectors
Figures 3-13 show the PEBV ratio trends for every sector since 1998.
We present the components of PEBV ratio – market cap and economic book value – for the NC 2000 and each NC 2000 sector in Appendix I.
Appendix II provides additional aggregated PEBV ratio analyses that adjusts for company size/market cap.
Basic Materials: PEBV Ratio = 2.2
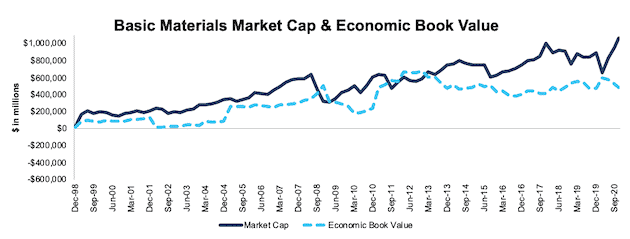
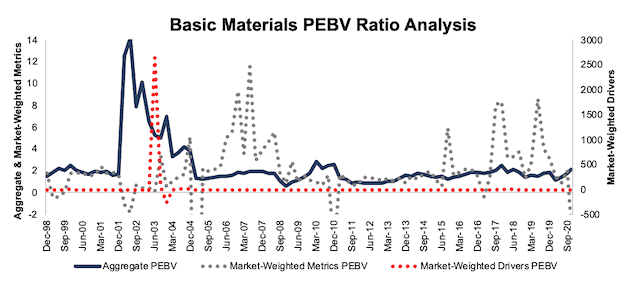
Figure 3 shows the PEBV ratio for the Basic Materials sector has fallen since 2017 but increased significantly since March 2020. The Basic Materials sector PEBV ratio is the highest since December 2017 and has rarely been higher dating back to 1998. Since the end of 2019, the sector market cap increased from $660 billion to $1.1 trillion TTM while its economic book value increased slightly from $595 billion to $489 billion over the same time.
Figure 3: Basic Materials PEBV Ratio: 1998 – 11/17/20
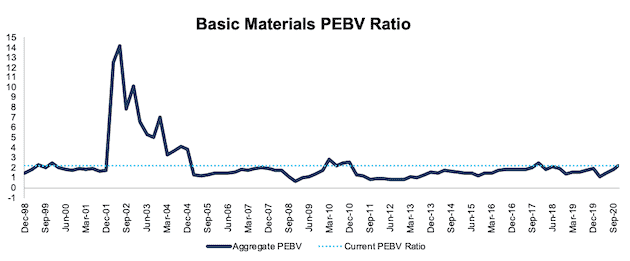
Sources: New Constructs, LLC and company filings.
Consumer Cyclicals: PEBV Ratio = 2.9
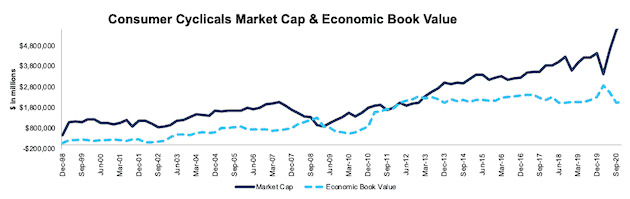
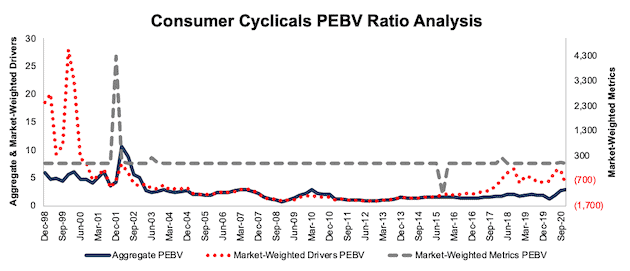
Figure 4 shows the PEBV ratio for the Consumer Cyclicals sector sits at the highest level since 2007, which suggests investors expect sector profits to rebound after the COVID-19-induced economic downturn. The sector market cap increased from $3.4 trillion at the end of 2019 to $5.9 trillion TTM, while its economic book value fell from $2.9 trillion to $2.1 trillion over the same time.
Figure 4: Consumer Cyclicals PEBV Ratio: 1998 – 11/17/20
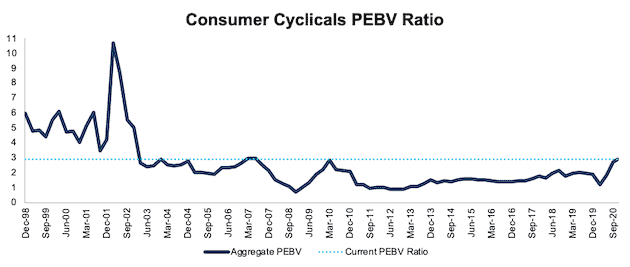
Sources: New Constructs, LLC and company filings.
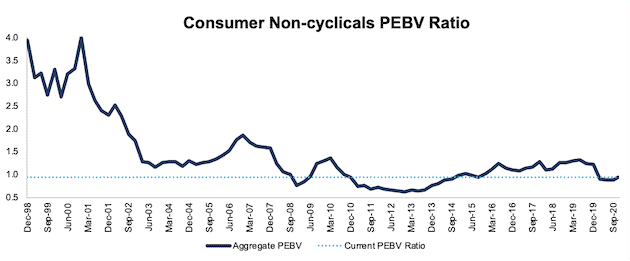
Consumer Non-cyclicals: PEBV Ratio = 0.9
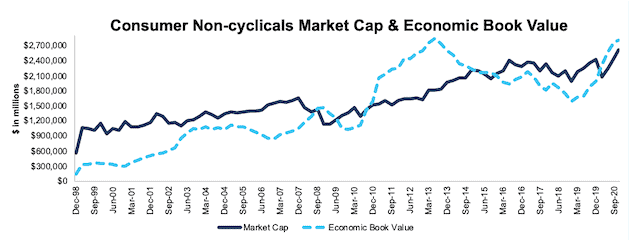
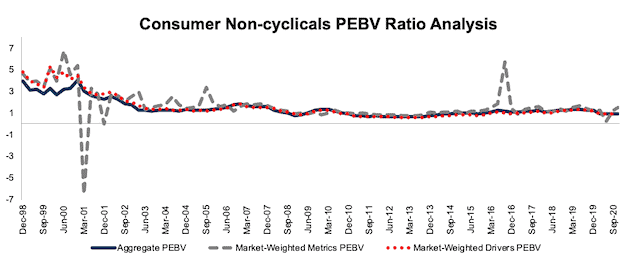
Figure 5 shows the PEBV ratio for the Consumer Non-cyclicals sector is still below recent highs from 2016-2019. The sector market cap rose from $2.1 trillion at the end of 2019 to $2.6 trillion TTM. The sector’s economic book value increased from $2.3 trillion to $2.8 trillion over the same time.
Figure 5: Consumer Non-cyclicals PEBV Ratio: 1998 – 11/17/20
Sources: New Constructs, LLC and company filings.
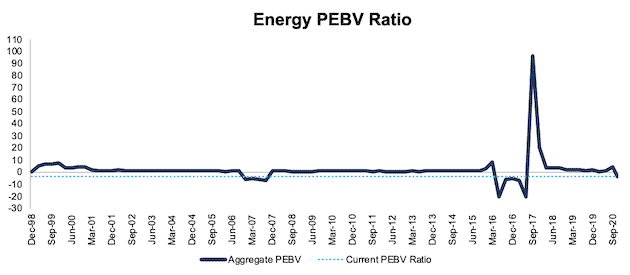
Energy: PEBV Ratio = -3.8
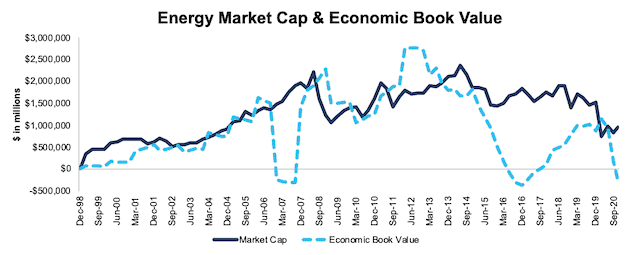
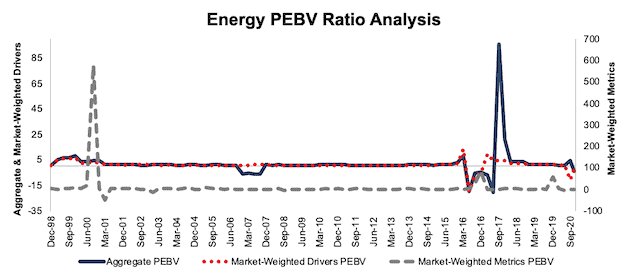
Figure 6 shows the COVID-19 impact on the Energy sector’s valuation, which results in a negative PEBV ratio for the first time since mid-2017. The Energy sector market cap fell from $1.5 trillion at the end of 2019 to $959 billion TTM, while its economic book value fell from $1.1 trillion to -$255 billion over the same time. The large change in 2017 is driven by a large improvement in economic book value as oil prices, and therefore Energy firms’ profits, recovered from the precipitous fall in 2014-2016.
Figure 6: Energy PEBV Ratio: 1998 – 11/17/20
Sources: New Constructs, LLC and company filings.
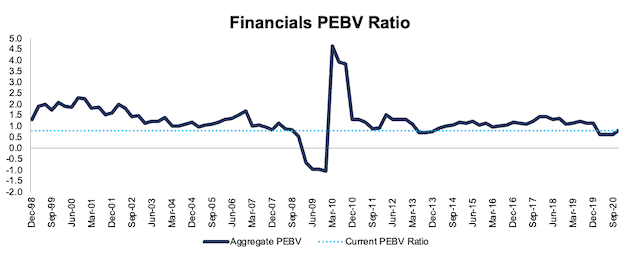
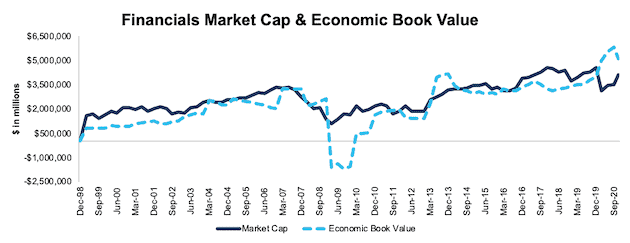
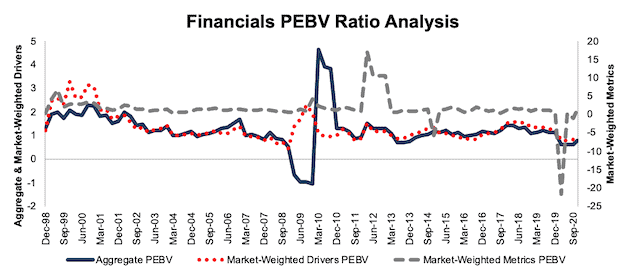
Financials: PEBV Ratio = 0.8
Figure 7 shows PEBV ratio for the Financials sector has been largely stable except for the Financial Crisis and currently trades below recent highs. The Financials sector market cap rose from $3.1 trillion at the end of 2019 to $4.1 trillion TTM, and its economic book value rose from $5.0 trillion to $5.1 trillion over the same time.
Figure 7: Financials PEBV Ratio: 1998 – 11/17/20
Sources: New Constructs, LLC and company filings.
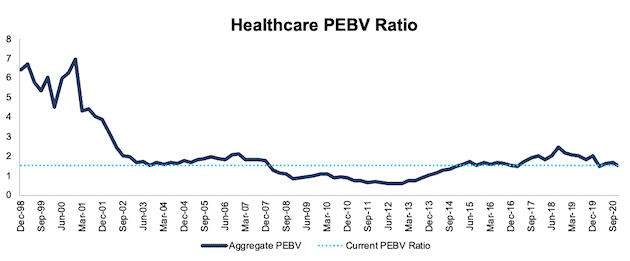
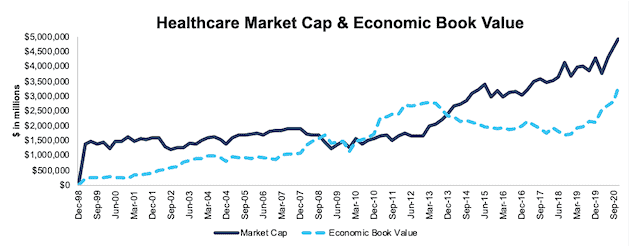
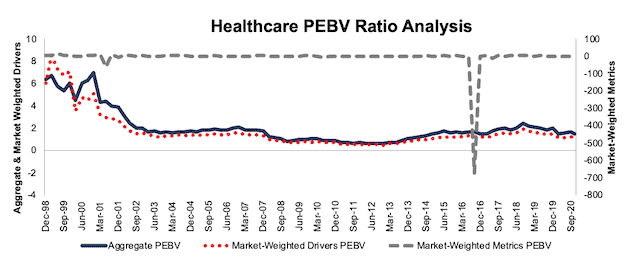
Healthcare: PEBV Ratio = 1.5
Figure 8 shows PEBV ratio for the Healthcare sector is at its lowest level since 2017. Figure 8 also shows how cheap the Healthcare sector was during and after the Financial Crisis as it consistently traded below its economic book value from mid-2008 through 2013. The Healthcare sector market cap increased from $3.8 trillion at the end of 2019 to $4.9 trillion TTM, while its economic book value improved from $2.5 trillion to $3.3 trillion over the same time.
Figure 8: Healthcare PEBV Ratio: 1998 – 11/17/20
Sources: New Constructs, LLC and company filings.
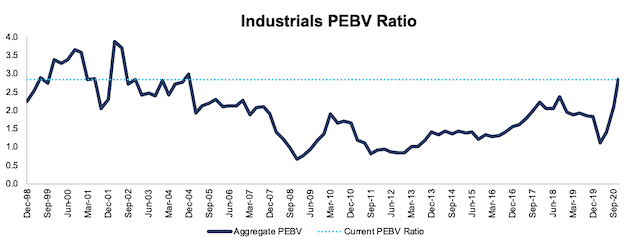
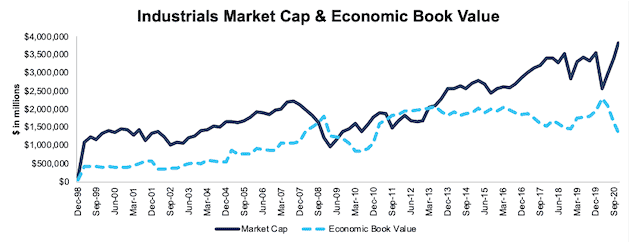
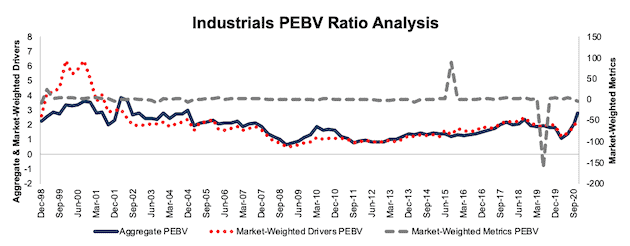
Industrials: PEBV Ratio = 2.8
Figure 9 shows the PEBV ratio for the Industrials sector increased significantly since the end of 2019. The ratio is currently at the highest level since late 2004 and indicates investors expect the sector’s profitability to rebound in a big way. The Industrials sector market cap rose from $2.6 trillion at the end of 2019 to $3.8 trillion TTM, while its economic book value declined from $2.3 trillion to $1.3 trillion over the same time.
Figure 9: Industrials PEBV Ratio: 1998 – 11/17/20
Sources: New Constructs, LLC and company filings.
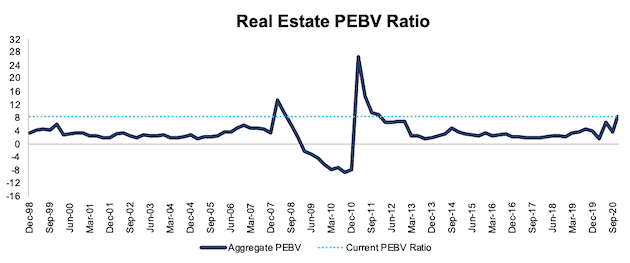
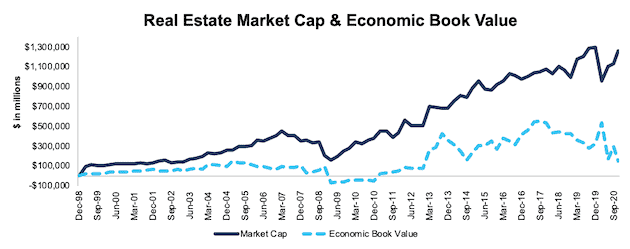
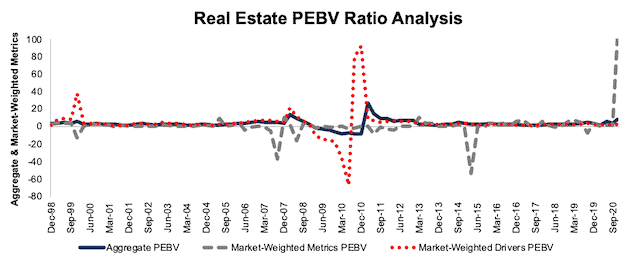
Real Estate: PEBV Ratio = 8.5
Figure 10 shows the PEBV ratio for the Real Estate sector is relatively stagnant save for the run up and crash around the Financial Crisis. The current sector PEBV ratio is the highest since December 2011. The Real Estate sector market cap slightly fell from $1.3 trillion at the end of 2019 to $1.26 trillion TTM, while its economic book value fell from $536 billion to $147 billion over the same time.
Figure 10: Real Estate PEBV Ratio: 1998 – 11/17/20
Sources: New Constructs, LLC and company filings.
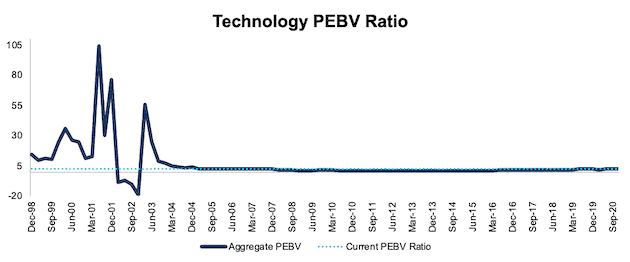
Technology: PEBV Ratio = 2.3
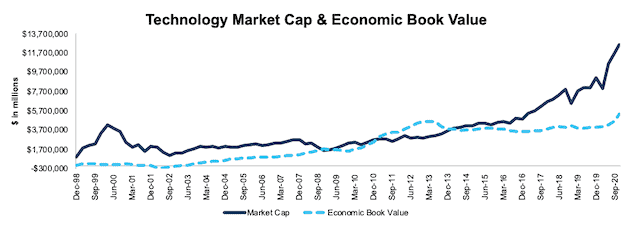
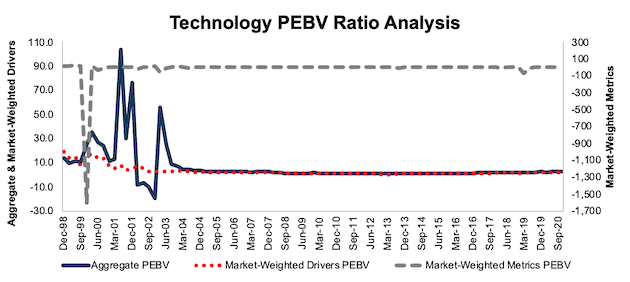
Figure 11 shows the massive volatility in the Technology sector’s valuation during and after the tech-bubble. Now, the PEBV ratio for the Technology sector is near its highest level since late-2007. The Technology sector market cap increased from $8.0 trillion at the end of 2019 to $12.5 trillion TTM, and its economic book value improved from $4.1 trillion to $5.3 trillion over the same time.
Figure 11: Technology PEBV Ratio: 1998 – 11/17/20
Sources: New Constructs, LLC and company filings.
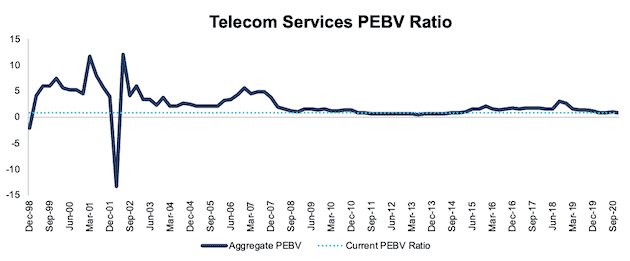
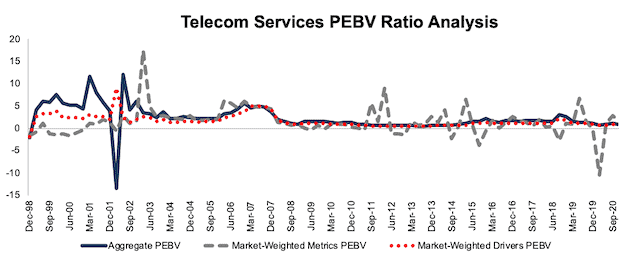
Telecom Services: PEBV Ratio = 0.9
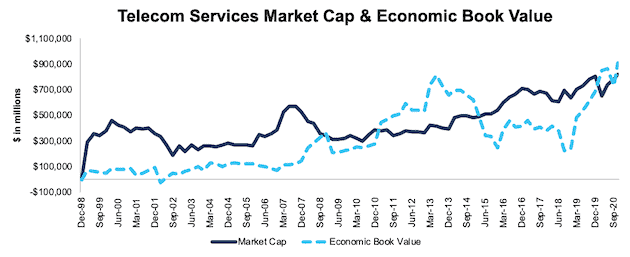
Figure 12 shows the PEBV ratio for the Telecom Services sector spiked in 2018 but the sector’s economic book value has since risen above the sector’s market cap. The sector market cap rose from $652 billion at the end of 2019 to $817 billion TTM, and its economic book value rose from $851 billion to $909 billion over the same time.
Figure 12: Telecom Services PEBV Ratio: 1998 – 11/17/20
Sources: New Constructs, LLC and company filings.
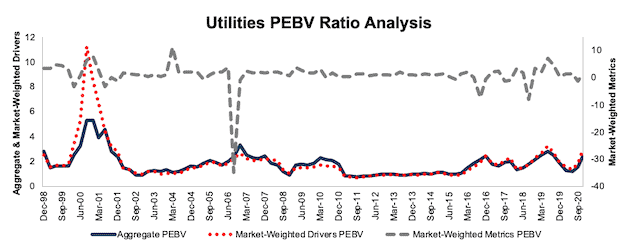
Utilities: PEBV Ratio = 2.4
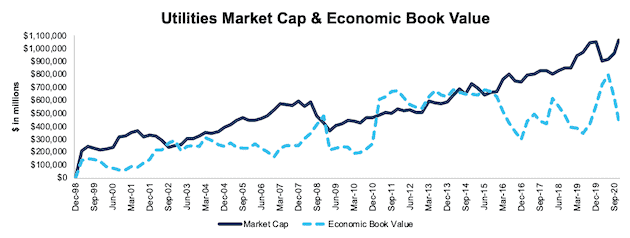
Figure 13 shows the volatile nature of the PEBV ratio for the Utilities sector. The sector’s current PEBV ratio has only been surpassed a few times since the beginning of our analysis in December 1998. The Utilities sector market cap rose slightly from $1.05 trillion at the end of 2019 to $1.06 trillion TTM, while its economic book value fell from $723 billion to $445 billion over the same time.
Figure 13: Utilities PEBV Ratio: 1998 – 11/17/20
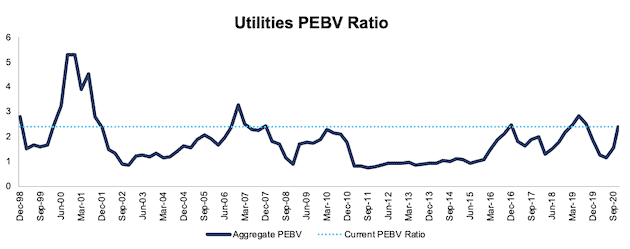
Sources: New Constructs, LLC and company filings.
This article originally published on December 18, 2020.
Disclosure: David Trainer, Kyle Guske II, Alex Sword, and Matt Shuler receive no compensation to write about any specific stock, style, or theme.
Follow us on Twitter, Facebook, LinkedIn, and StockTwits for real-time alerts on all our research.
Appendix I: NC 2000: Market Cap & Economic Book Value Since 1998
This appendix shows the two drivers used to calculate PEBV ratio – market cap and economic book value (EBV) – for the NC 2000 and each NC 2000 sector going back to December 1998. We sum the individual NC 2000/sector constituent values for market cap and economic book value. We call this approach the “Aggregate” methodology, and it matches S&P Global’s (SPGI) methodology for these calculations. More methodology details in Appendix II.
Figure 14 ranks all 11 sectors by TTM market cap. It shows the Technology sector’s potentially outsized impact on the NC 2000, with a market cap more than double the size of the next closest sector, Consumer Cyclicals.
Figure 14: Market Cap by Sector – TTM as of 11/17/20
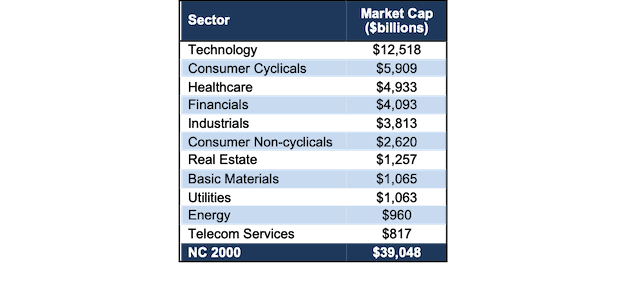
Sources: New Constructs, LLC and company filings.
Figure 15 ranks all 11 NC 2000 sectors by TTM economic book value. It shows that the Technology sector also has the highest economic book value – though the EBV of the next closest sector is not far below.
Figure 15: Economic Book Value by Sector – TTM as of 11/17/20
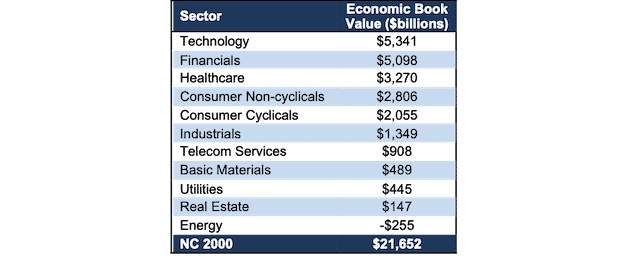
Sources: New Constructs, LLC and company filings.
Figures 16-27 compare the market cap and economic book value trends for the NC 2000 and every sector since 1998.
Note the much more prolonged price downturn during the Financial Crisis compared to the rapid recovery after the COVID-19-induced market crash.
Figure 16: NC 2000 Market Cap & Economic Book Value: 1998 – 11/17/20
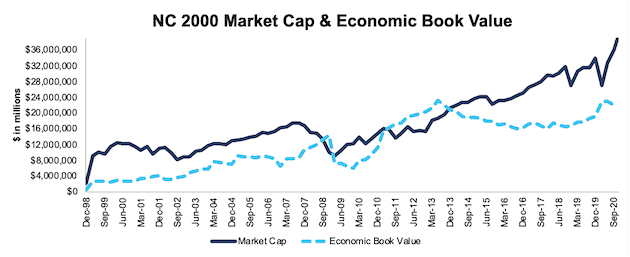
Sources: New Constructs, LLC and company filings.
Figure 17: Basic Materials Market Cap & Economic Book Value: 1998 – 11/17/20
Sources: New Constructs, LLC and company filings.
Figure 18: Consumer Cyclicals Market Cap & Economic Book Value: 1998 – 11/17/20
Sources: New Constructs, LLC and company filings.
Figure 19: Consumer Non-cyclicals Market Cap & Economic Book Value: 1998 – 11/17/20
Sources: New Constructs, LLC and company filings.
Figure 20: Energy Market Cap & Economic Book Value: 1998 – 11/17/20
Sources: New Constructs, LLC and company filings.
Figure 21: Financials Market Cap & Economic Book Value: 1998 – 11/17/20
Sources: New Constructs, LLC and company filings.
Figure 22: Healthcare Market Cap & Economic Book Value: 1998 – 11/17/20
Sources: New Constructs, LLC and company filings.
Figure 23: Industrials Market Cap & Economic Book Value: 1998 – 11/17/20
Sources: New Constructs, LLC and company filings.
Figure 24: Real Estate Market Cap & Economic Book Value: 1998 – 11/17/20
Sources: New Constructs, LLC and company filings.
Figure 25: Technology Market Cap & Economic Book Value: 1998 – 11/17/20
Sources: New Constructs, LLC and company filings.
Figure 26: Telecom Services Market Cap & Economic Book Value: 1998 – 11/17/20
Sources: New Constructs, LLC and company filings.
Figure 27: Utilities Market Cap & Economic Book Value: 1998 – 11/17/20
Sources: New Constructs, LLC and company filings.
Appendix II: Analyzing PEBV Ratio with Different Weighting Methodologies
We derive the metrics above by summing the individual NC 2000/sector constituent values for market cap and economic book value to calculate PEBV ratio. We call this approach the “Aggregate” methodology.
The Aggregate methodology provides a straightforward look at the entire NC 2000/sector, regardless of firm size or index weighting, and matches how S&P Global (SPGI) calculates metrics for the S&P 500.
For additional perspective, we compare the Aggregate method for PEBV ratio with two other market-weighted methodologies. These market-weighted methodologies add more value for ratios that do not include market values, e.g. ROIC and its drivers, but we include them here, nonetheless, for comparison:
- Market-weighted metrics – calculated by market-cap-weighting the PEBV ratio for the individual companies relative to their sector or the overall NC 2000 in each period. Details:
- Company weight equals the company’s market cap divided by the market cap of the NC 2000 or its sector
- We multiply each company’s PEBV ratio by its weight
- NC 2000/Sector PEBV ratio equals the sum of the weighted PEBV ratios for all the companies in the NC 2000/sector
- Market-weighted drivers – calculated by market-cap-weighting the market cap and economic book value for the individual companies in each sector in each period. Details:
- Company weight equals the company’s market cap divided by the market cap of the NC 2000 or its sector
- We multiply each company’s market cap and economic book value by its weight
- We sum the weighted market cap and weighted economic book value for each company in the NC 2000/each sector to determine the NC 2000 or sector’s weighted market cap and weighted economic book value
- NC 2000/Sector PEBV ratio equals weighted NC 2000/sector market cap divided by weighted NC 2000/sector economic book value
Each methodology has its pros and cons, as outlined below:
Aggregate method
Pros:
- A straightforward look at the entire NC 2000/sector, regardless of company size or weighting in any indices.
- Matches how S&P Global calculates metrics for the S&P 500.
Cons:
- Vulnerable to impact of companies entering/exiting the group of companies, which could unduly affect aggregate values. Also susceptible to outliers in any one period.
Market-weighted metrics method
Pros:
- Accounts for a firm’s market cap relative to the NC 2000/sector and weights its metrics accordingly.
Cons:
- Vulnerable to outlier results from a single company disproportionately impacting the overall PEBV ratio, as we’ll show below.
Market-weighted drivers method
Pros:
- Accounts for a firm’s market cap relative to the NC 2000/sector and weights its size and economic book value accordingly.
- Mitigates the disproportionate impact of outlier results from one company on the overall results.
Cons:
- More susceptible to large swings in market cap or economic book value period over period, particularly from firms with a large weighting in the NC 2000/Sector.
Figures 28-39 compare these three methods for calculating NC 2000 and sector PEBV ratio. We provide some high-level commentary on why certain sectors show some interesting results. Clients can contact us for access to the underlying data to study the results in more detail.
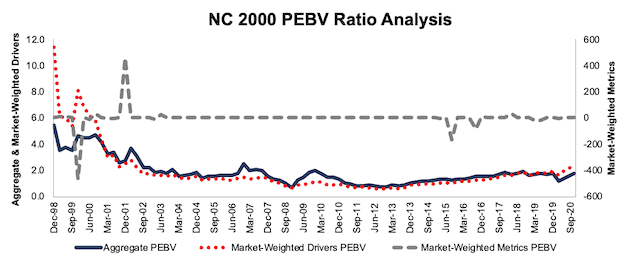
In Figure 28, the sharp decline in the market-weighted metrics PEBV ratio for the NC 2000 in 2015, along with the sharp increase in 2018, are driven largely by volatility in Amazon’s (AMZN) economic book value. The first instance was caused by a sharp decline in the firm’s net operating profit after-tax (NOPAT), coupled with an increase in weighted average cost of capital (WACC), which resulted in a negative economic book value and negative 16,606 PEBV. The second instance, in 2018, was caused by the significant increase in debt after the firm’s acquisition of Whole Foods, which caused economic book value to fall precipitously and PEBV ratio to rise to nearly 1,228.
This analysis highlights the outsized sensitivity of the market-weighted metrics methodology to outlier results from a single company with a large market cap, such as Amazon.
Figure 28: NC 2000 PEBV Ratio Methodologies Compared: 1998 – 11/17/20
Sources: New Constructs, LLC and company filings.
Figure 29: Basic Materials PEBV Ratio Methodologies Compared: 1998 – 11/17/20
Sources: New Constructs, LLC and company filings.
In Figure 30, Amazon drives the sharp decline in the market-weighted metrics PEBV ratio for the Consumer Cyclicals Sector in 2015 along with the sharp increase in 2018, as noted for the NC 2000 above. The impacts are even larger on the sector-level results, as Amazon represented 8% of the sector in 2015 and 22% in 2018.
Figure 30: Consumer Cyclicals PEBV Ratio Methodologies Compared: 1998 – 11/17/20
Sources: New Constructs, LLC and company filings.
In Figure 31, the sharp increase in the market-weighted metrics PEBV ratio for the Consumer Non-cyclicals sector in 2016, is driven by Kraft Heinz (KHC). The merger between Kraft and Heinz caused the combined firms’ economic book value to improve from -$15 billion in June 2016 to $1 billion in September 2016, which resulted in PEBV ratio rising from negative 7 to positive 98 over the same time.
Figure 31: Consumer Non-cyclicals PEBV Ratio Methodologies Compared: 1998 – 11/17/20
Sources: New Constructs, LLC and company filings.
In Figure 32, the sharp increase in the market-weighted metrics PEBV ratio for the Energy sector in 2016, is driven largely by Exxon Mobil (XOM). As a result of crashing oil prices, XOM’s NOPAT more than halved in 2015 and 2016’s NOPAT was still 41% below 2014. The significant decline in profitability caused an equally large drop in XOM’s economic book value and resulted in XOM’s PEBV ratio increasing from 14 in June 2016 to 425 in December 2016. Given its large weighting in the sector, this increase had an outsized impact on the sector’s market-weighted metrics PEBV ratio during this time.
Figure 32: Energy PEBV Ratio Methodologies Compared: 1998 – 11/17/20
Sources: New Constructs, LLC and company filings.
In Figure 33, the sharp decrease in the market-weighted metrics PEBV ratio for the Financials sector in 2019, is driven largely by Fiserv (FISV) and its $22 billion acquisition of First Data. The acquisition significantly increased Fiserv’s total debt, which resulted in a negative economic book value and PEBV ratio that created a drag on the entire sector.
Figure 33: Financials PEBV Ratio Methodologies Compared: 1998 – 11/17/20
Sources: New Constructs, LLC and company filings.
Figure 34: Healthcare PEBV Ratio Methodologies Compared: 1998 – 11/17/20
Sources: New Constructs, LLC and company filings.
Figure 35: Industrials PEBV Ratio Methodologies Compared: 1998 – 11/17/20
Sources: New Constructs, LLC and company filings.
Figure 36: Real Estate PEBV Ratio Methodologies Compared: 1998 – 11/17/20
Sources: New Constructs, LLC and company filings.
In Figure 37, the decrease in the market-weighted metrics PEBV ratio in 2019, is driven largely by Netflix’s (NFLX) rising total debt, which caused a significant drop in the firm’s economic book value from one quarter to the next. A subsequent rise in NOPAT drove the ratio back to positive territory.
Figure 37: Technology PEBV Ratio Methodologies Compared: 1998 – 11/17/20
Sources: New Constructs, LLC and company filings.
Figure 38: Telecom Services PEBV Ratio Methodologies Compared: 1998 – 11/17/20
Sources: New Constructs, LLC and company filings.
Figure 39: Utilities PEBV Ratio Methodologies Compared: 1998 – 11/17/20
Sources: New Constructs, LLC and company filings.
[1] We calculate these metrics based on S&P Global’s (SPGI) methodology, which sums the individual S&P 500 constituent values for market cap and economic book value before using them to calculate the metrics. We call this the “Aggregate” methodology. Get more details in Appendix I and II.
[2] For 3rd-party reviews, including The Journal of Financial Economics, on the benefits of adjusted fundamental data across all stocks, click here and here.