
This report analyzes the drivers[1] of economic earnings [return on invested capital (ROIC), NOPAT margin, invested capital turns, and weighted average cost of capital (WACC)] for the NC 2000 and each sector since 1998. It also compliments our large cap research on the S&P 500 and its sectors.
The NC 2000 consists of the largest 2000 U.S. companies by market cap in our coverage. Constituents are updated on a quarterly basis (March 31, June 30, September 30, and December 31). We exclude companies that report under IFRS and non-U.S. ADR companies.
For reference, we analyze the Core Earnings for the entire NC 2000 and each sector in “All Cap Analysis: Net Income Understates Core Earnings in 2020”.
These reports leverage cutting-edge technology to provide clients with a cleaner and more comprehensive view of corporate performance[2]. Investors armed with our measures of profitability enjoy a differentiated and more informed view of the fundamentals of companies and sectors.
Only the Consumer Non-cyclicals sector has seen an improvement in return on invested capital (ROIC) since the end of 2019.
NC 2000 ROIC Falls Significantly Thus Far in 2020
ROIC for the NC 2000 began to decline in 2019 before falling significantly this year. The NC 2000’s ROIC fell from 7.5% at the end of 2019 to 6.5% through 11/17/20 (the earliest date updated 10-Qs for the NC 2000 constituents were available), per Figure 1.
All NC 2000 sectors except for one saw a drop in ROIC, though some more than others, as we’ll show below. We expect these trends to continue at the overall market and sector levels. Nevertheless, at the individual stock level, we see excellent long and short opportunities in the companies whose performances diverge materially from their sector and the overall market. For details, see our reports: “See Through the Dip” Stocks Significantly Outperform S&P 500” and “The Most Dangerous Stocks for Fiduciaries.”
Figure 1: TTM ROIC and WACC for the NC 2000 From 1998 – 11/17/20
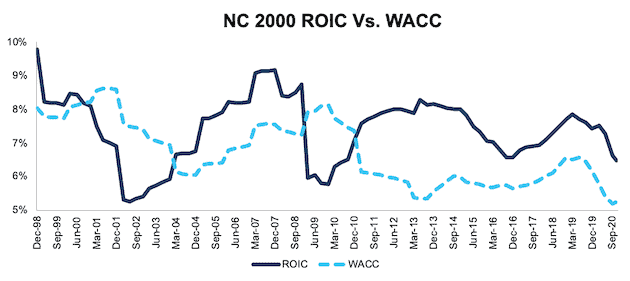
Sources: New Constructs, LLC and company filings.
Ranking All NC 2000 Sectors by Change in ROIC
Figure 2 shows the Consumer Non-cyclicals sector’s TTM ROIC has improved by 30 basis points since 2019.
Figure 2: ROIC as of 11/17/20 vs. 2019 by Sector
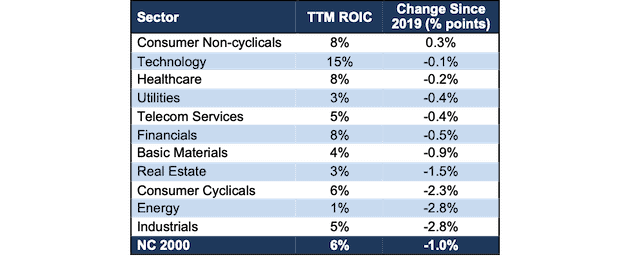
Sources: New Constructs, LLC and company filings.
The Consumer Non-cyclicals sector has performed best through the COVID-19 pandemic, as measured by change in ROIC since the end of 2019. This trend is not surprising, given that the global shutdowns impacted travel, infrastructure, leisure, and other discretionary spending while providing a boost to many Consumer Non-cyclicals firms.
On the flip side, the Industrials sector has the largest drop in ROIC and performed worst since the end of 2019.
Overall, the Technology sector earns the highest ROIC of all sectors, by far, and the Energy sector earns the lowest ROIC. These rankings in the Technology and Energy sector mirror the ROIC rankings for the S&P 500 sectors we analyze in “Only Two S&P 500 Sectors Have a Rising ROIC Through 3Q20.”
Details on each of the NC 2000 Sectors
Figures 3-13 compare the ROIC and WACC trends for every sector since 1998. Appendix I presents the current WACC for each sector.
Appendix II presents the drivers of ROIC – NOPAT margin and invested capital turns – for each sector.
Appendix III presents additional ROIC analysis based on different weighting methodologies to adjust for the impact of a firm’s size on the overall sector and market.
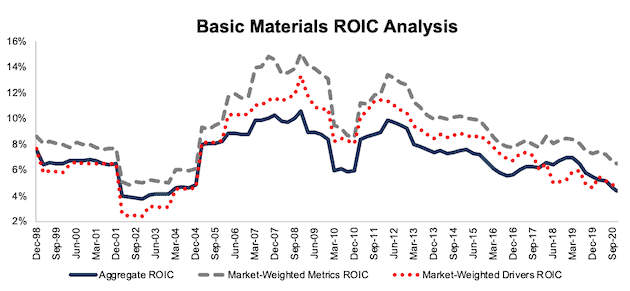
Basic Materials
Figure 3 shows the ROIC for the Basic Materials sector has been in a long-term decline since ~2008 and fell 86 basis points since the end of 2019. The Basic Materials sector ROIC was and remains below the sector’s WACC. NOPAT margin fell from 8.9% in 2019 to 7.8% TTM, and invested capital turns fell from 0.59 to 0.56, over the same time.
Figure 3: Basic Materials ROIC vs. WACC: 1998 – 11/17/20
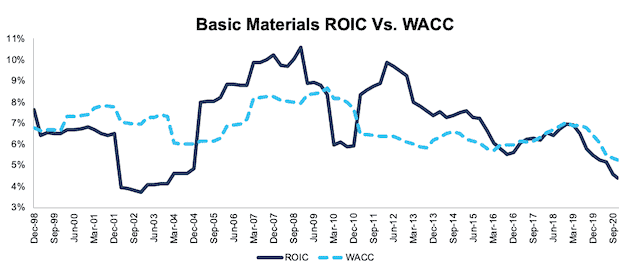
Sources: New Constructs, LLC and company filings.
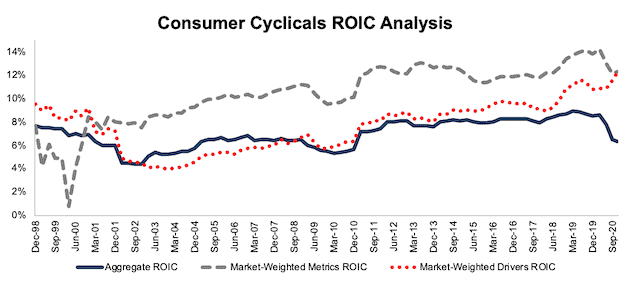
Consumer Cyclicals
Figure 4 shows the ROIC for the Consumer Cyclicals sector was hit hard by the COVID-19 pandemic and has fallen to its lowest level since 2010. The significant decline in 2020 mirrors the large drop in Core Earnings highlighted in “All Cap Analysis: Net Income Understates Core Earnings in 2020.” This decline is the result of deteriorating operational and capital efficiency. NOPAT margin fell from 7.5% in 2019 to 6.0% TTM, and invested capital turns declined from 1.2 to 1.1 over the same time.
Figure 4: Consumer Cyclicals ROIC vs. WACC: 1998 – 11/17/20
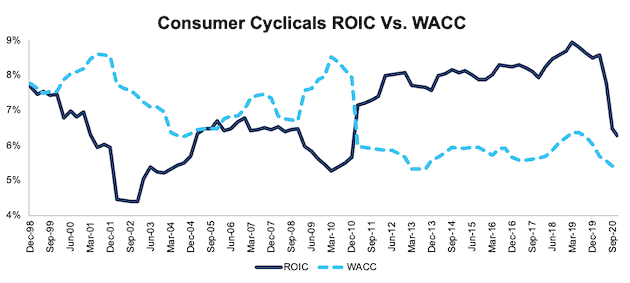
Sources: New Constructs, LLC and company filings.
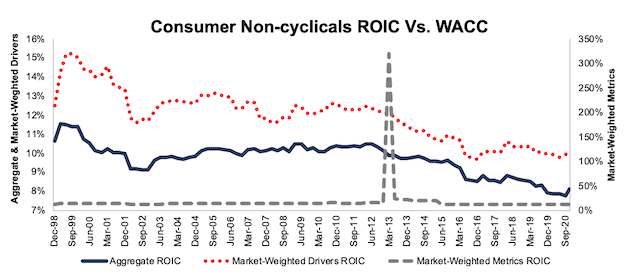
Consumer Non-cyclicals
Figure 5 shows ROIC for the Consumer Non-Cyclicals sector slightly rose from 7.9% in 2019 to 8.1% TTM. While the TTM NOPAT margin fell from 5.9% in 2019 to 5.8% TTM, invested capital turns rose from 1.33 in 2019 to 1.40 TTM and drove ROIC higher. Investors only analyzing margins will miss the fact that improved balance sheet efficiency drives ROIC higher for many companies in this sector.
Figure 5: Consumer Non-cyclicals ROIC vs. WACC: 1998 – 11/17/20
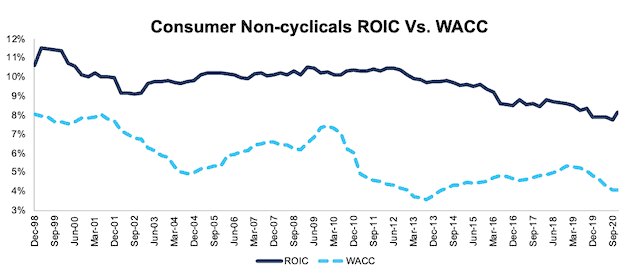
Sources: New Constructs, LLC and company filings.
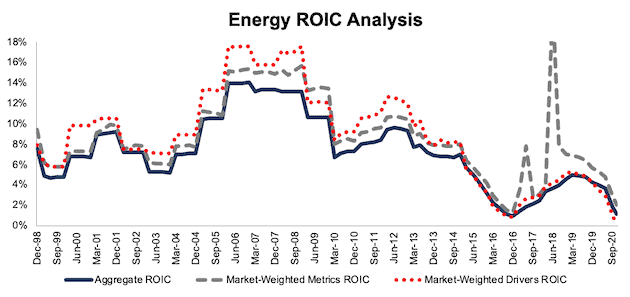
Energy
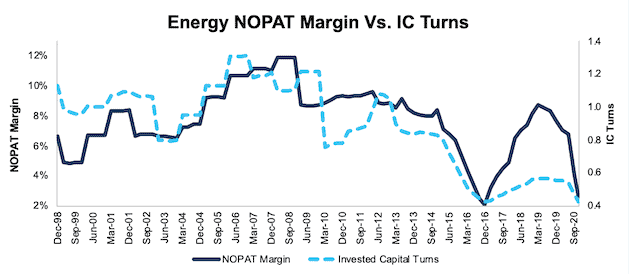
Figure 6 shows the ROIC for the Energy sector was one of the hardest hit of all sectors as the COVID-19 pandemic combined with increased production from Saudi Arabia and Russia drove oil prices down. The deteriorating ROIC wiped out all the improvement achieved from 2016 to mid-2019. The decline in ROIC is largely driven by NOPAT margin falling from 7.1% at the end of 2019 to 2.6% TTM. Invested capital turns also fell from 0.56 to 0.43 over the same time.
Figure 6: Energy ROIC vs. WACC: 1998 – 11/17/20
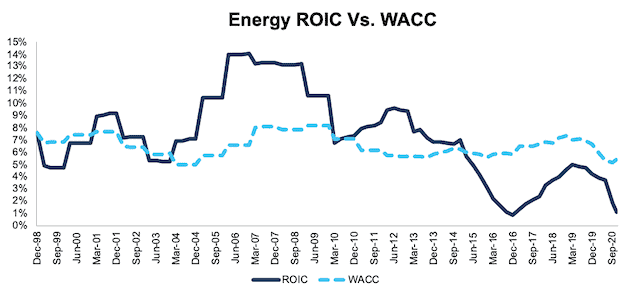
Sources: New Constructs, LLC and company filings.
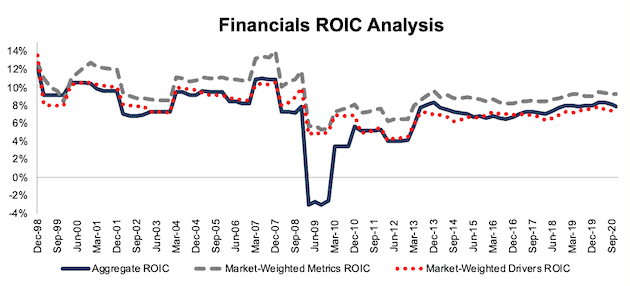
Financials
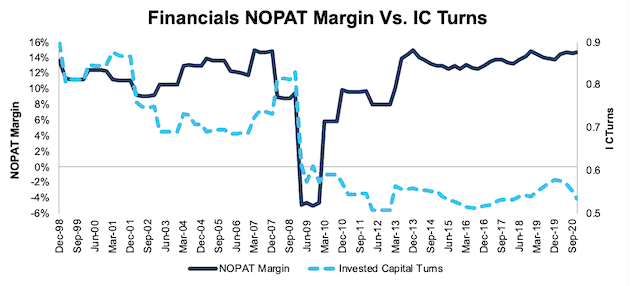
Figure 7 shows ROIC for the Financials sector declined 48 basis points since the end of 2019 but remains well above the lows of the Financial Crisis. Given the stability in ROIC since 2013, one could argue regulators were successful in turning large Financial firms into “boring”, more stable businesses. NOPAT margin rose slightly, from 14.5% at the end of 2019 to 14.7% TTM while invested capital turns fell from 0.58 to 0.54 over the same time.
Figure 7: Financials ROIC vs. WACC: 1998 – 11/17/20
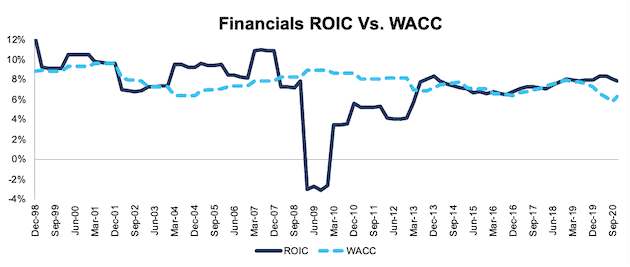
Sources: New Constructs, LLC and company filings.
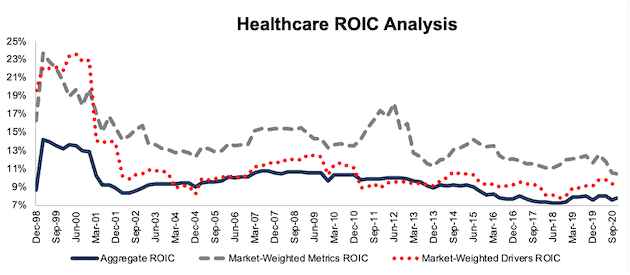
Healthcare
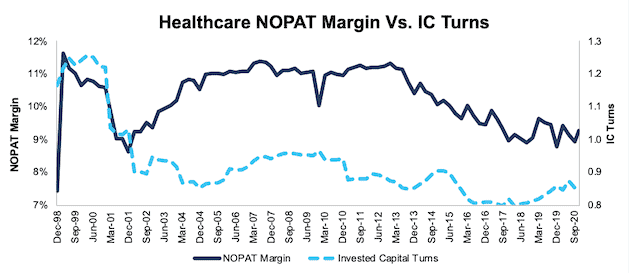
Figure 8 shows ROIC for the Healthcare sector declined just 16 basis points since the end of 2019 and has remained relatively stable since the end of 2016. The decline in ROIC is driven by NOPAT margin falling from 9.4% in 2019 to 9.3% TTM. Meanwhile, the sector’s invested capital turns of 0.85 are unchanged from 2019.
Figure 8: Healthcare ROIC vs. WACC: 1998 – 11/17/20
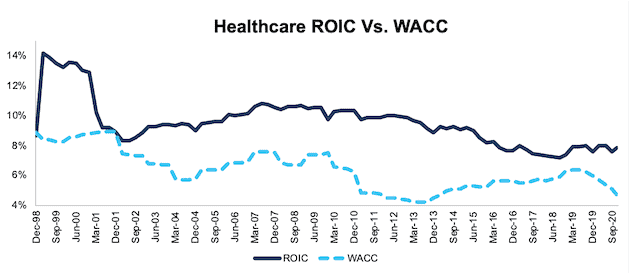
Sources: New Constructs, LLC and company filings.
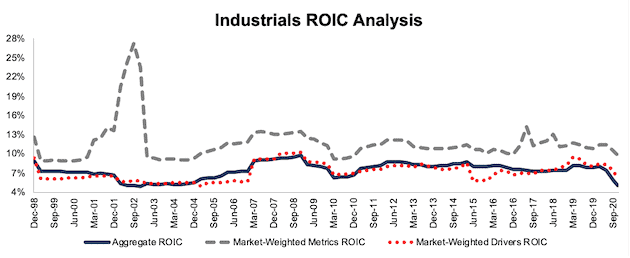
Industrials
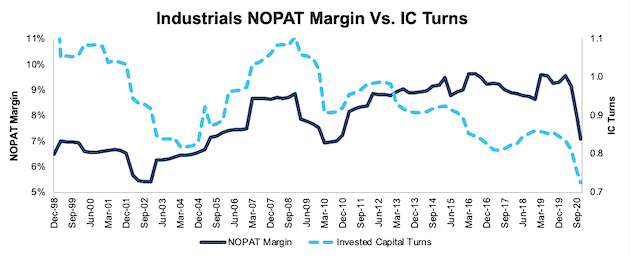
Figure 9 shows ROIC for the Industrials sector was the hardest hit this year and fell 283 basis points since the end of 2019 as the sector bore much of the brunt of the global shutdowns. NOPAT margin fell from 9.6% at the end of 2019 to 7.1% TTM, and invested capital turns fell from 0.83 to 0.72 over the same time.
Figure 9: Industrials ROIC vs. WACC: 1998 – 11/17/20
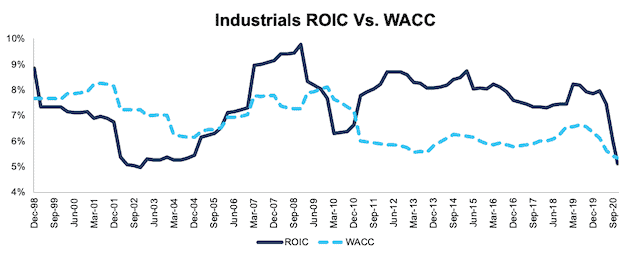
Sources: New Constructs, LLC and company filings.
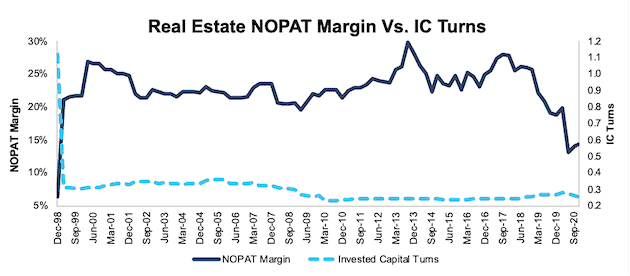
Real Estate
Figure 10 shows ROIC for the Real Estate sector fell significantly since the end of 2019. Longer term, the ROIC for the Real Estate sector has been in decline since 2000. NOPAT margin fell from 19.8% at the end of 2019 to 14.4% TTM, and invested capital turns fell from 0.23 to 0.21 over the same time.
Figure 10: Real Estate ROIC vs. WACC: 1998 – 11/17/20
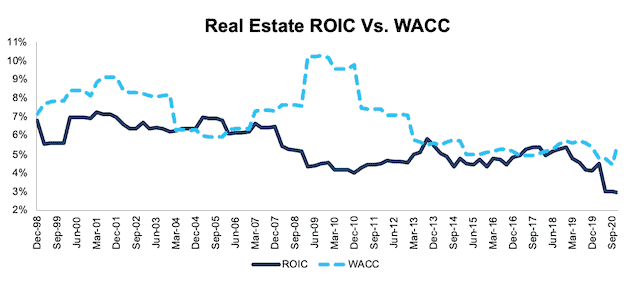
Sources: New Constructs, LLC and company filings.
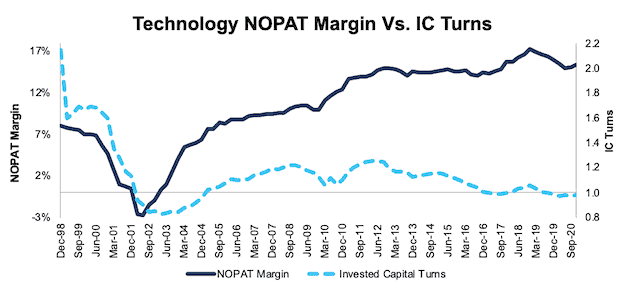
Technology
Figure 11 shows the ROIC for the Technology sector declined since the end of 2018 but remains in a long-term uptrend since 2001. The Technology sector’s ROIC of 15% is nearly double the next highest sector ROIC of 8%. The Technology sector’s NOPAT margin fell from 15.5% at the end of 2019 to 15.4% TTM. Invested capital turns of 0.98 over the TTM are unchanged from 2019.
Figure 11: Technology ROIC vs. WACC: 1998 – 11/17/20
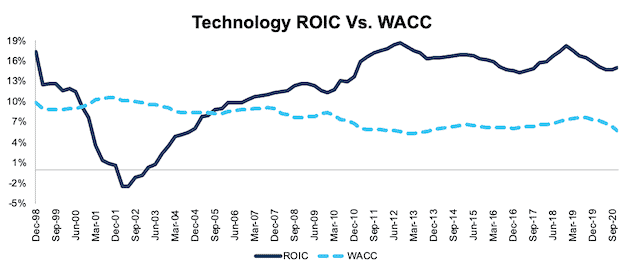
Sources: New Constructs, LLC and company filings.
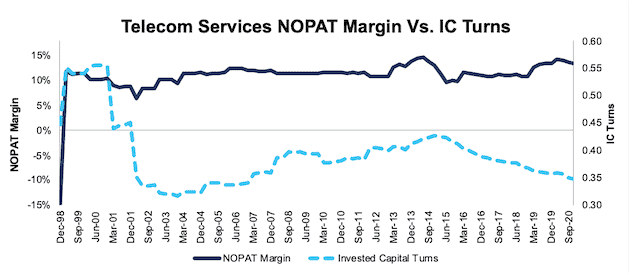
Telecom Services
Figure 12 shows the ROIC for the Telecom Services sector has fallen 41 basis points since the end of 2019 and remains below its 2014 levels. The NOPAT margin for the sector fell from 14.3% at the end of 2019 to 13.6% TTM and invested capital turns fell from 0.36 to 0.35 over the same time.
Figure 12: Telecom Services ROIC vs. WACC: 1998 – 11/17/20
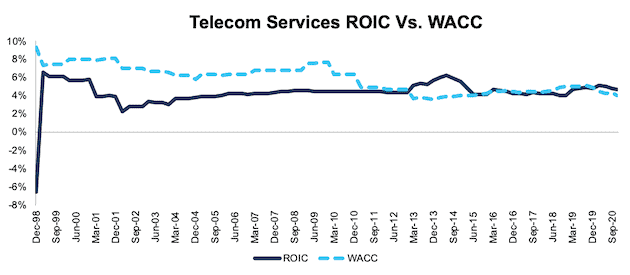
Sources: New Constructs, LLC and company filings.
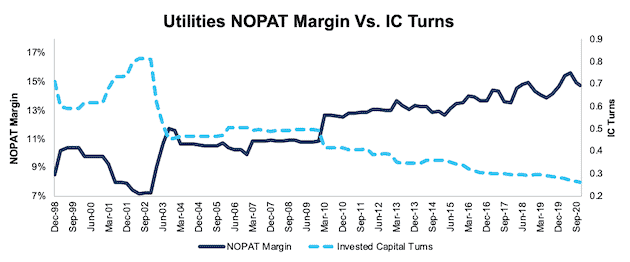
Utilities
Figure 13 shows the ROIC for the Utilities sector declined 35 basis points since the end of 2019 and remains below the sector’s WACC. The decline this year follows the long-term trend since 1998. NOPAT margin for the sector fell from 15.4% at the end of 2019 to 14.8% TTM, and invested capital turns fell from 0.23 to 0.21 over the same time.
Figure 13: Utilities ROIC vs. WACC: 1998 – 11/17/20
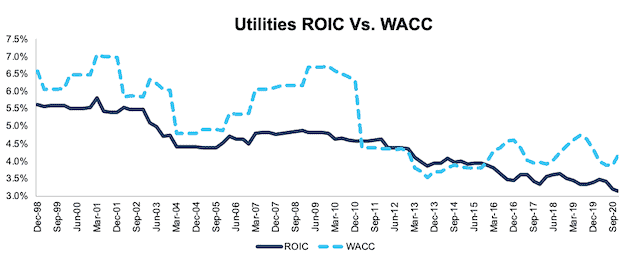
Sources: New Constructs, LLC and company filings.
This article originally published on December 14, 2020.
Disclosure: David Trainer, Kyle Guske II, and Matt Shuler receive no compensation to write about any specific stock, style, or theme.
Follow us on Twitter, Facebook, LinkedIn, and StockTwits for real-time alerts on all our research.
Appendix I: WACC for Each Sector and NC 2000
This appendix shows the WACC for the NC 2000 and each sector as of 11/17/20.
We derive the sector and NC 2000 WACCs by solving for WACC in the economic earnings formula:
(ROIC-WACC)*Average Invested Capital = Economic Earnings
translates to
WACC = ROIC - Economic Earnings/Average Invested Capital
We calculate Economic Earnings, NOPAT and Invested Capital according to the Aggregate methodology described in Appendix III.
Figure 14: WACC by Sector – TTM as of 11/17/20
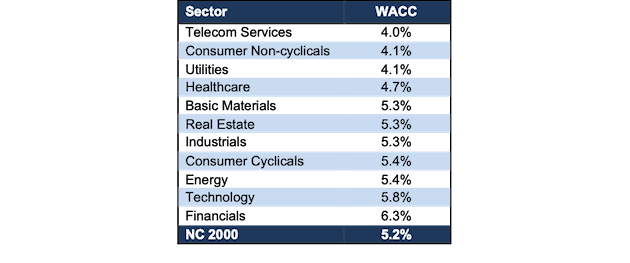
Sources: New Constructs, LLC and company filings.
Appendix II: NOPAT Margin and Invested Capital Turns Since 1998
This appendix shows the two key drivers (DuPont model) of ROIC – NOPAT margin and invested capital turns – for each sector going back to 1998. We sum the individual NC 2000/sector constituent values for revenue, NOPAT, and invested capital to calculate these metrics. We call this approach the “Aggregate” methodology. More methodology details in Appendix III.
Figure 15 ranks all 11 sectors by TTM NOPAT margin.
Figure 15: NOPAT Margin by Sector – TTM as of 11/17/20
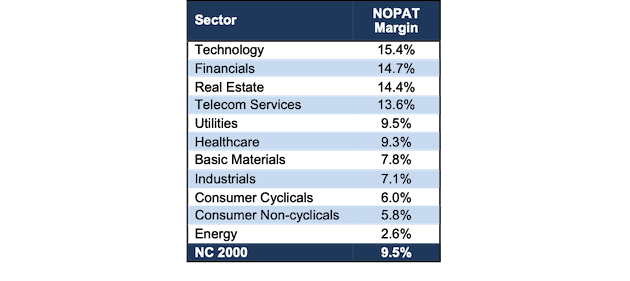
Sources: New Constructs, LLC and company filings.
Figure 16 ranks all 11 sectors by TTM invested capital turns.
Figure 16: Invested Capital Turns by Sector – TTM as of 11/17/20
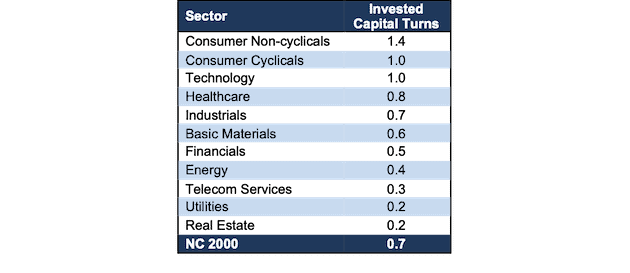
Sources: New Constructs, LLC and company filings.
These two tables show how rare it is for a sector to have both high margins and capital turns. Real Estate, the highest margin sector, has the second-worst invested capital turns. Consumer Non-cyclicals, the sector with the highest invested capital turns has the second lowest margin. The Technology sector has both high margins and invested capital turns, which is why that sector leads the market in ROIC by a wide margin.
Figures 17-28 compare the NOPAT margin and invested capital turns trends for the NC 2000 and every sector since 1998.
Figure 17: NC 2000 NOPAT Margin and IC Turns: 1998 – 11/17/20
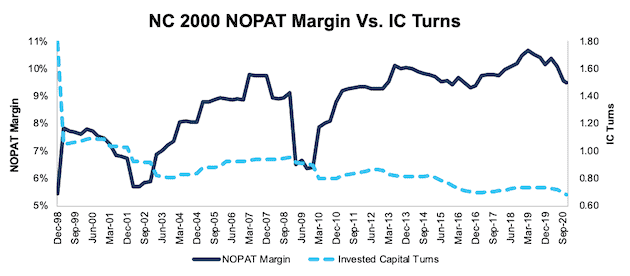
Sources: New Constructs, LLC and company filings.
Figure 18: Basic Materials NOPAT Margin and IC Turns: 1998 – 11/17/20
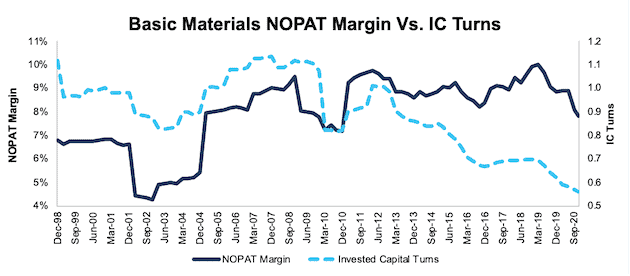
Sources: New Constructs, LLC and company filings.
Figure 19: Consumer Cyclicals NOPAT Margin and IC Turns: 1998 – 11/17/20
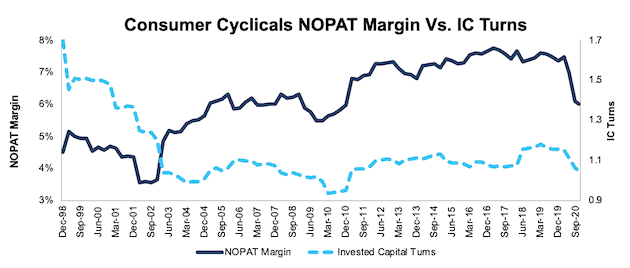
Sources: New Constructs, LLC and company filings.
Figure 20: Consumer Non-Cyclicals NOPAT Margin and IC Turns: 1998 – 11/17/20
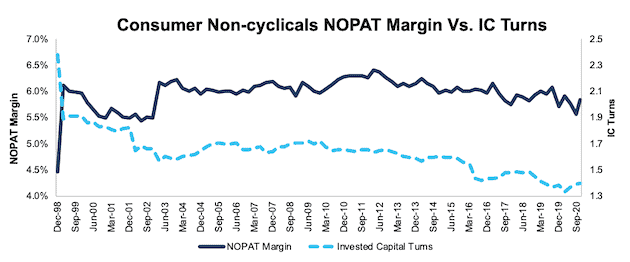
Sources: New Constructs, LLC and company filings.
Figure 21: Energy NOPAT Margin and IC Turns: 1998 – 11/17/20
Sources: New Constructs, LLC and company filings.
Figure 22: Financials NOPAT Margin and IC Turns: 1998 – 11/17/20
Sources: New Constructs, LLC and company filings.
Figure 23: Healthcare NOPAT Margin and IC Turns: 1998 – 11/17/20
Sources: New Constructs, LLC and company filings.
Figure 24: Industrials NOPAT Margin vs. IC Turns: 1998 – 11/17/20
Sources: New Constructs, LLC and company filings.
Figure 25: Real Estate NOPAT Margin Vs. IC Turns: 1998 – 11/17/20
Sources: New Constructs, LLC and company filings.
Figure 26: Technology NOPAT Margin Vs. IC Turns: 1998 – 11/17/20
Sources: New Constructs, LLC and company filings.
Figure 27: Telecom Services NOPAT Margin Vs. IC Turns: 1998 – 11/17/20
Sources: New Constructs, LLC and company filings.
Figure 28: Utilities NOPAT Margin vs. IC Turns: 1998 – 11/17/20
Sources: New Constructs, LLC and company filings.
Appendix III: Analyzing ROIC with Different Weighting Methodologies
We derive the metrics above by summing the individual NC 2000/sector constituent values for revenue, NOPAT, and invested capital to calculate the metrics presented. We call this approach the “Aggregate” methodology.
The Aggregate methodology provides a straightforward look at the entire sector, regardless of market cap or index weighting and matches how S&P Global (SPGI) calculates metrics for the S&P 500.
For additional perspective, we compare the Aggregate method for ROIC with two other market-weighted methodologies:
- Market-weighted metrics – calculated by market-cap-weighting the ROIC for the individual companies relative to their sector or the overall NC 2000 in each period. Details:
- Company weight equals the company’s market cap divided by the market cap of the NC 2000/its sector
- We multiply each company’s ROIC by its weight
- NC 2000/Sector ROIC equals the sum of the weighted ROICs for all the companies in the NC 2000/each sector
- Market-weighted drivers – calculated by market-cap-weighting the NOPAT and invested capital for the individual companies in the NC 2000/each sector in each period. Details:
- Company weight equals the company’s market cap divided by the market cap of the NC2000/its sector
- We multiply each company’s NOPAT and invested capital by its weight
- We sum the weighted NOPAT and invested capital for each company in the NC 2000/each sector to determine the NC 2000/sector’s weighted NOPAT and weighted invested capital
- NC 2000/Sector ROIC equals weighted NC 2000/sector NOPAT divided by weighted NC 2000/sector invested capital
Each methodology has its pros and cons, as outlined below:
Aggregate method
Pros:
- A straightforward look at the entire NC 2000/sector, regardless of company size or weighting in any indices.
- Matches how S&P Global calculates metrics for the S&P 500.
Cons:
- Vulnerable to impact of by companies entering/exiting the group of companies, which could unduly affect aggregate values despite the level of change from companies that remain in the group.
Market-weighted metrics method
Pros:
- Accounts for a firm’s size relative to the overall NC 2000/sector and weights its metrics accordingly.
Cons:
- Vulnerable to outsized impact of one or a few companies, as shown below in the Consumer Non-cyclicals sector. This outsized impact tends to occur only for ratios where unusually small denominator values can create extremely high or low results.
Market-weighted drivers method
Pros:
- Accounts for a firm’s size relative to the overall NC 2000/sector and weights its NOPAT and invested capital accordingly.
- Mitigates potential outsized impact of one or a few companies by aggregating values that drive the ratio before calculating the ratio.
Cons:
- Can minimize the impact of period-over-period changes in smaller companies, as their impact on the overall sector NOPAT and invested capital is smaller.
Figures 29-40 compare these three methods for calculating NC 2000 and sector ROICs.
In Figure 29, we chart the market-weighted metrics version of ROIC on its own axis to highlight the differences in the aggregate and market-weighted drivers versions of ROIC.
Note the impact on the market-weighted metrics version of ROIC for the entire NC 2000 from Lorillard (LO) in 2013, when the firm’s ROIC was more than 36,000%.
Figure 29: NC 2000 ROIC Methodologies Compared: 1998 – 11/17/20
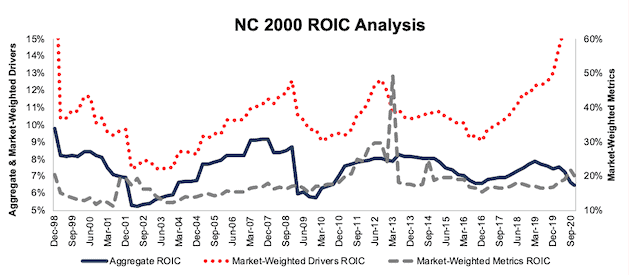
Sources: New Constructs, LLC and company filings.
Figure 30: Basic Materials ROIC Methodologies Compared: 1998 – 11/17/20
Sources: New Constructs, LLC and company filings.
Figure 31: Consumer Cyclicals ROIC Methodologies Compared: 1998 – 11/17/20
Sources: New Constructs, LLC and company filings.
Note the impact on the market-weighted metrics version of ROIC for the Consumer Non-cyclicals sector from Lorillard (LO) in 2013, when the firm’s ROIC was more than 36,000%.
This outlier caused the Consumer Non-cyclicals sector’s ROIC to increase from 15% to 321% in just one period, before falling to 24% one period later.
Figure 32: Consumer Non-cyclicals ROIC Methodologies Compared: 1998 – 11/17/20
Sources: New Constructs, LLC and company filings.
Figure 33: Energy ROIC Methodologies Compared: 1998 – 11/17/20
Sources: New Constructs, LLC and company filings.
Figure 34: Financials ROIC Methodologies Compared: 1998 – 11/17/20
Sources: New Constructs, LLC and company filings.
Figure 35: Healthcare ROIC Methodologies Compared: 1998 – 11/17/20
Sources: New Constructs, LLC and company filings.
Figure 36: Industrials ROIC Methodologies Compared: 1998 – 11/17/20
Sources: New Constructs, LLC and company filings.
Figure 37: Real Estate ROIC Methodologies Compared: 1998 – 11/17/20
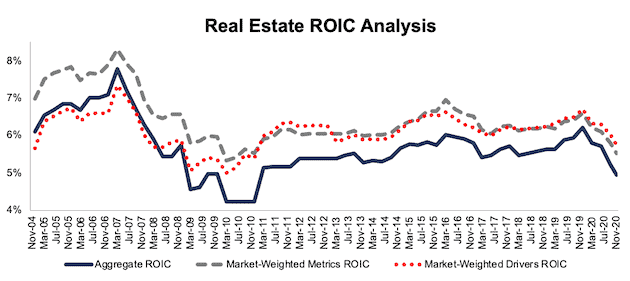
Sources: New Constructs, LLC and company filings.
Figure 38: Technology ROIC Methodologies Compared: 1998 – 11/17/20
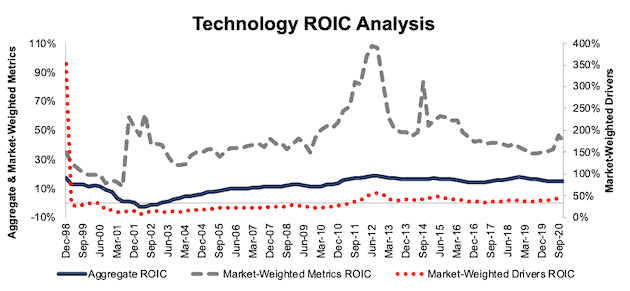
Sources: New Constructs, LLC and company filings.
Figure 39: Telecom Services ROIC Methodologies Compared: 1998 – 11/17/20
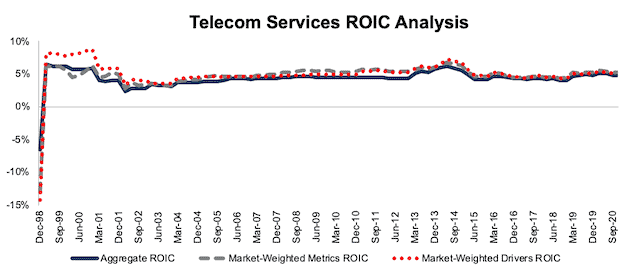
Sources: New Constructs, LLC and company filings.
Figure 40: Utilities ROIC Methodologies Compared: 1998 – 11/17/20
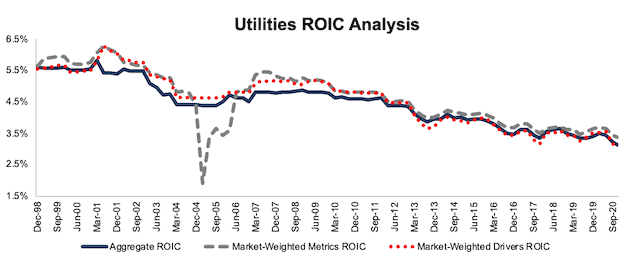
Sources: New Constructs, LLC and company filings.
[1] We calculate these metrics based on SPGI’s methodology, which sums the individual NC 2000 constituent values for NOPAT and invested capital before using them to calculate the metrics. We call this the “Aggregate” methodology. Get more details in Appendix III. See Appendix I for details on how we calculate WACC for the NC 2000 and each of its sectors.
[2] For 3rd-party reviews, including The Journal of Financial Economics, on the benefits of adjusted Core Earnings, historically and prospectively, across all stocks, click here and here.