
The COVID-19 pandemic and ensuing economic damage dropped 2020 Core Earnings[1] for the NC 2000, our proxy for an All Cap index, to the lowest level since mid-2017. This report presents the Core Earnings of our All Cap Index and each of its sectors to narrow in on where the most damage was done. This research is based on the latest audited financial data, which is the 2020 10-K for most companies.
The NC 2000 consists of the largest 2000 U.S. companies by market cap in our coverage. Constituents are updated on a quarterly basis (March 31, June 30, September 30, and December 31). We exclude companies that report under IFRS and non-U.S. ADR companies.
These reports leverage more reliable fundamental data[2] that enables investors to overcome flaws with legacy fundamental datasets. Investors armed with our research enjoy a differentiated and more informed view of the fundamentals and valuations of companies and sectors.
Within the NC 2000, as with the S&P 500, only the Technology, Consumer Non-cyclicals, Telecom Services, and Healthcare sectors saw a year-over-year (YoY) rise in Core Earnings in 2020. Given consumer habits during the pandemic, Core Earnings improvement in these sectors is not a surprise, as the shift to work-from-home, pantry loading, and a V-shaped recovery in healthcare spending drove growth in these sectors more than others.
Rankings the Sectors by Core Earnings Growth
Figure 1 ranks all 11 NC 2000 sectors by the change in Core Earnings from 2019 to 2020[3].
Figure 1: 2020 Core Earnings vs. Last year by NC 2000 Sector
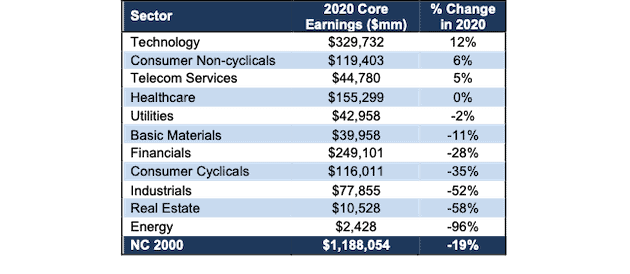
Sources: New Constructs, LLC and company filings.
Our Core Earnings analysis is based on aggregated TTM data for the sector constituents.
The Technology sector generates the most Core Earnings by far (over 32% more than the next closest sector) and grew Core Earnings by 12% YoY in 2020. On the flip side, the Energy sector has the lowest Core Earnings and the largest YoY drop in 2020. Even though oil prices have recently begun to climb, the COVID-19 shutdowns across the globe hit the energy sector hardest over the past year.
Details on the NC 2000 & 11 Sectors
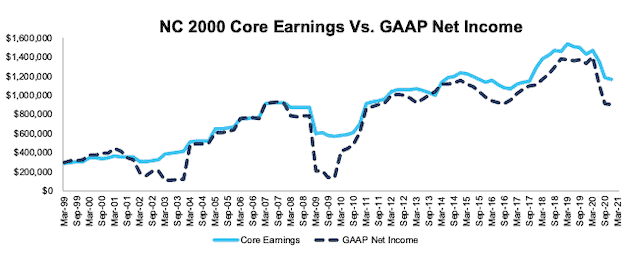
Figures 2-13 compare the Core Earnings and GAAP net income trends for the NC 2000 and every NC 2000 sector since December 1998.
NC 2000
Figure 2 shows the Core Earnings for the NC 2000 fell 19% YoY in 2020, which is less than the 35% drop in GAAP net income over the same time. Figure 2 also highlights the severe impacts brought on by the COVID-19 pandemic as Core Earnings for the NC 2000 sit at the lowest level since mid-2017.
Figure 2: NC 2000 Core Earnings Vs. GAAP: 1998 – 2020
Sources: New Constructs, LLC and company filings.
Our Core Earnings analysis is based on aggregated TTM data for the sector constituents in each measurement period.
The March 23, 2021 measurement period incorporates the financial data from 2020 10-Ks, as this is the earliest date for which all the 2020 10-Ks for the NC 2000 constituents were available.
Basic Materials
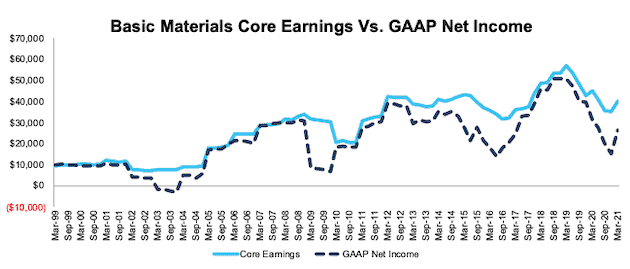
Figure 3 shows Core Earnings for the Basic Materials sector peaked in 2018 and ended 2020 30% below the peak. Asset write-downs, which occurred at record levels through the first half of 2020, help explain the disconnect between Core Earnings and GAAP net income.
Dupont De Nemours (DD), LyondellBasell Industries (LYB), and WestRock Company (WRK) combined for write-downs of $5.2 billion in 2020, which equals 13% of the Basic Materials sector’s 2020 Core Earnings.
Figure 3: Basic Materials Core Earnings Vs. GAAP: 1998 – 2020
Sources: New Constructs, LLC and company filings.
Our Core Earnings analysis is based on aggregated TTM data for the sector constituents in each measurement period.
The March 23, 2021 measurement period incorporates the financial data from 2020 10-Ks, as this is the earliest date for which all the 2020 10-Ks for the NC 2000 constituents were available.
Consumer Cyclicals
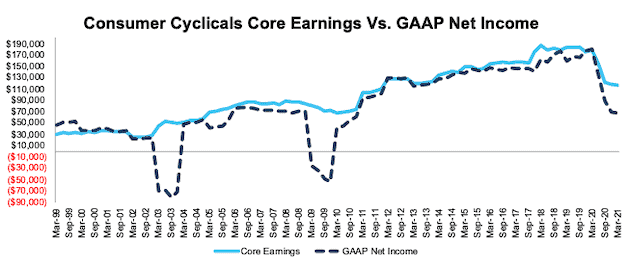
Figure 4 shows that the COVID-19 pandemic impacted the Consumer Cyclicals sector differently than during the early 2000’s and Financial Crisis, when Core Earnings were largely unchanged. Global shutdowns and depressed leisure spending caused Core Earnings to fall 35% YoY in 2020.
Figure 4: Consumer Cyclicals Core Earnings Vs. GAAP: 1998 – 2020
Sources: New Constructs, LLC and company filings.
Our Core Earnings analysis is based on aggregated TTM data for the sector constituents in each measurement period.
The March 23, 2021 measurement period incorporates the financial data from 2020 10-Ks, as this is the earliest date for which all the 2020 10-Ks for the NC 2000 constituents were available.
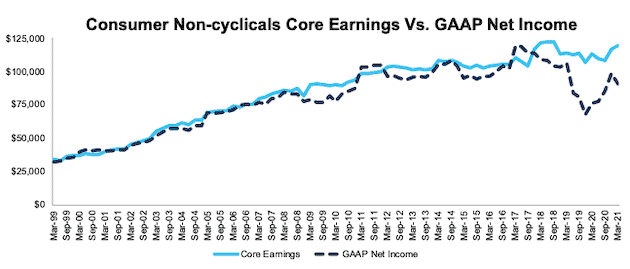
Consumer Non-Cyclicals
Figure 5 shows Core Earnings for the Consumer Non-Cyclicals sector have been relatively stable over time and rose 6% YoY in 2020. However, investors looking at GAAP net income would have seen a much different picture. The drastic drop in GAAP net income in early 2019 is a result of Kraft Heinz’s (KHC) ~$16 billion write-down. Our Core Earnings remove such unusual charges, so investors get more accurate, and less volatile, views of profits.
Figure 5: Consumer Non-Cyclicals Core Earnings Vs. GAAP: 1998 – 2020
Sources: New Constructs, LLC and company filings.
Our Core Earnings analysis is based on aggregated TTM data for the sector constituents in each measurement period.
The March 23, 2021 measurement period incorporates the financial data from 2020 10-Ks, as this is the earliest date for which all the 2020 10-Ks for the NC 2000 constituents were available.
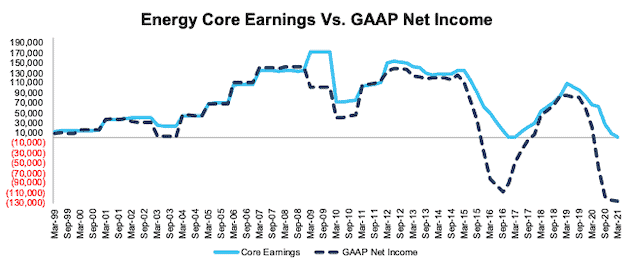
Energy
Figure 6 shows Core Earnings for the Energy sector fell 96% YoY in 2020 to levels last seen at the end of 2016. Four companies combined, Exxon Mobil (XOM), Baker Hughes (BKR), Occidental Petroleum (OXY), and Marathon Petroleum (MPC), reported over $52 billion in asset write-downs in 2020, which helps to explain the even larger drop in GAAP net income relative to Core Earnings.
Figure 6: Energy Core Earnings Vs. GAAP: 1998 – 2020
Sources: New Constructs, LLC and company filings.
Our Core Earnings analysis is based on aggregated TTM data for the sector constituents in each measurement period.
The March 23, 2021 measurement period incorporates the financial data from 2020 10-Ks, as this is the earliest date for which all the 2020 10-Ks for the NC 2000 constituents were available.
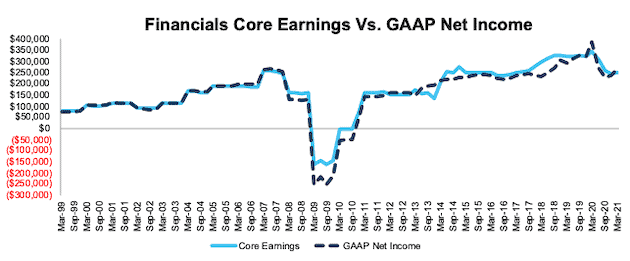
Financials
Figure 7 shows Core Earnings for the Financials sector, while down 28% YoY in 2020, have held up much better than during the Financial Crisis. The key difference between the two periods, as we pointed out in our Long Idea on JPMorgan Chase (JPM), is that many banks were the source of the problems that caused the Financial Crisis. On the other hand, today, Financial firms are playing a key role in the recovery.
Figure 7: Financials Core Earnings Vs. GAAP: 1998 – 2020
Sources: New Constructs, LLC and company filings.
Our Core Earnings analysis is based on aggregated TTM data for the sector constituents in each measurement period.
The March 23, 2021 measurement period incorporates the financial data from 2020 10-Ks, as this is the earliest date for which all the 2020 10-Ks for the NC 2000 constituents were available.
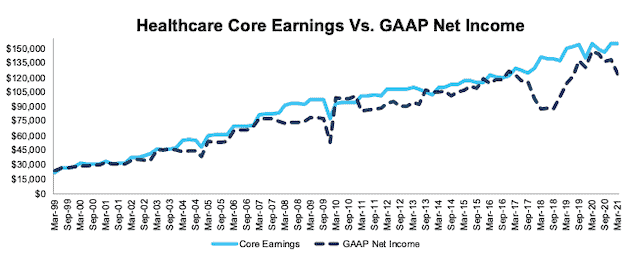
Healthcare
Figure 8 shows Core Earnings for the Healthcare sector have consistently increased since 1998 and rose <1% YoY in 2020. The consistent rise in demand for healthcare, after the initial drop in elective procedures during the onset of the COVID-19 pandemic, helps drive continued Core Earnings growth.
Figure 8: Healthcare Core Earnings Vs. GAAP: 1998 – 2020
Sources: New Constructs, LLC and company filings.
Our Core Earnings analysis is based on aggregated TTM data for the sector constituents in each measurement period.
The March 23, 2021 measurement period incorporates the financial data from 2020 10-Ks, as this is the earliest date for which all the 2020 10-Ks for the NC 2000 constituents were available.
Industrials
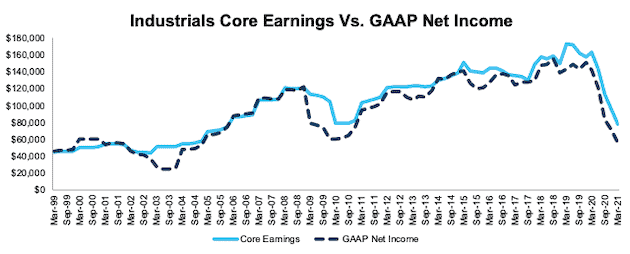
Figure 9 shows the Industrials sector is particularly impacted by COVID-19, as Core Earnings fell 52% YoY in 2020. Not surprisingly, the Industrials sector, which is most exposed to the drastic drop in airline travel and reduced capex across the globe, bore much of the brunt of the global shut downs.
Figure 9: Industrials Core Earnings Vs. GAAP: 1998 – 2020
Sources: New Constructs, LLC and company filings.
Our Core Earnings analysis is based on aggregated TTM data for the sector constituents in each measurement period.
The March 23, 2021 measurement period incorporates the financial data from 2020 10-Ks, as this is the earliest date for which all the 2020 10-Ks for the NC 2000 constituents were available.
Real Estate
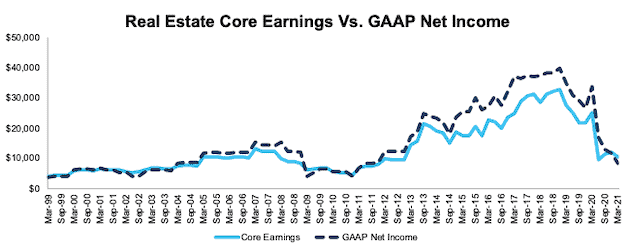
Figure 10 shows that after many years of consistent growth, Core Earnings for the Real Estate sector fell 58% YoY in 2020. This analysis also reveals the weakness in Real Estate firms outside of the S&P 500. The S&P 500 Real Estate sector’s Core Earnings fell just 15% YoY in 2020.
Figure 10: Real Estate Core Earnings Vs. GAAP: 1998 – 2020
Sources: New Constructs, LLC and company filings.
Our Core Earnings analysis is based on aggregated TTM data for the sector constituents in each measurement period.
The March 23, 2021 measurement period incorporates the financial data from 2020 10-Ks, as this is the earliest date for which all the 2020 10-Ks for the NC 2000 constituents were available.
Technology
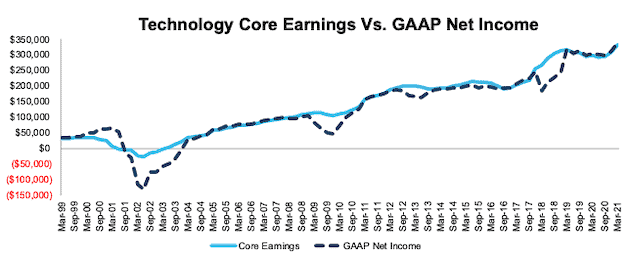
Figure 11 shows that not only did the Technology sector’s Core Earnings rise 12% YoY in 2020, but they have consistently risen since bottoming in early 2002. Our analysis of the NC 2000 and S&P 500 Technology sector further illustrates the “Fool’s Gold” nature of the sector. For example, the 74 stocks in the S&P 500 Technology sector generated $327 billion in Core Earnings in 2020 while the 316 stocks in the NC 2000 Technology sector generated $329 billion in Core Earnings in 2020.
Figure 11: Technology Core Earnings Vs. GAAP: 1998 – 2020
Sources: New Constructs, LLC and company filings.
Our Core Earnings analysis is based on aggregated TTM data for the sector constituents in each measurement period.
The March 23, 2021 measurement period incorporates the financial data from 2020 10-Ks, as this is the earliest date for which all the 2020 10-Ks for the NC 2000 constituents were available.
Telecom Services
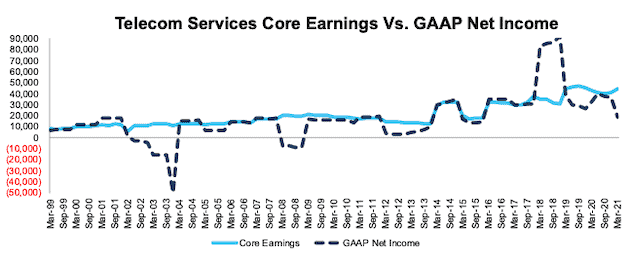
Figure 12 shows Core Earnings for the Telecom Services sector rose 5% YoY in 2020 while GAAP net income fell 45% over the same time. This disconnect is driven largely by AT&T (T)’s $15.5 billion write-down of assets and goodwill related to its video business. In total, AT&T’s asset write-downs equaled 35% of the sector’s Core Earnings in 2020.
The significant jump in GAAP net income in 2018 come from the Tax Cuts and Jobs Act. At the time, we identified Verizon (VZ) and AT&T (T) as the biggest winners of tax reform, and in 2017, they recorded nearly $25 billion in combined income tax benefits. Note how our Core Earnings adjusts for the anomalous, one-time tax effects.
Figure 12: Telecom Services Core Earnings Vs. GAAP: 1998 – 2020
Sources: New Constructs, LLC and company filings.
Our Core Earnings analysis is based on aggregated TTM data for the sector constituents in each measurement period.
The March 23, 2021 measurement period incorporates the financial data from 2020 10-Ks, as this is the earliest date for which all the 2020 10-Ks for the NC 2000 constituents were available.
Utilities
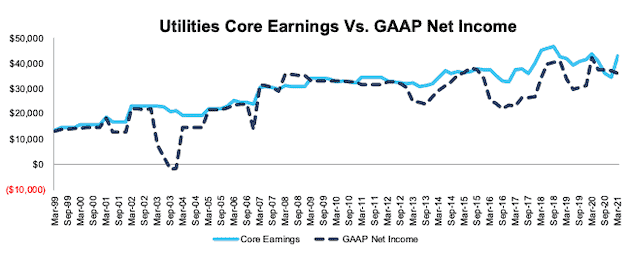
Figure 13 shows the Utilities sector has consistently grown Core Earnings since 1998, but in 2020, Core Earnings for the Utilities sector fell 2% YoY.
Figure 13: Utilities Core Earnings Vs. GAAP: 1998 – 2020
Sources: New Constructs, LLC and company filings.
Our Core Earnings analysis is based on aggregated TTM data for the sector constituents in each measurement period.
The March 23, 2021 measurement period incorporates the financial data from 2020 10-Ks, as this is the earliest date for which all the 2020 10-Ks for the NC 2000 constituents were available.
This article originally published on April 15, 2021.
Disclosure: David Trainer, Kyle Guske II, and Matt Shuler receive no compensation to write about any specific stock, style, or theme.
Follow us on Twitter, Facebook, LinkedIn, and StockTwits for real-time alerts on all our research.
Appendix: Calculation Methodology
We derive the Core Earnings and GAAP Net Income metrics above by summing the Trailing Twelve Month individual NC 2000 constituent values for Core Earnings and GAAP Net Income in each sector for each measurement period. We call this approach the “Aggregate” methodology.
The Aggregate methodology provides a straightforward look at the entire sector, regardless of market cap or index weighting and matches how S&P Global (SPGI) calculates metrics for the S&P 500.
[1] Only Core Earnings enable investors to overcome the inaccuracies, omissions and biases in legacy fundamental data and research, as proven in Core Earnings: New Data & Evidence, written by professors at Harvard Business School (HBS) & MIT Sloan and forthcoming in The Journal of Financial Economics.
[2] For 3rd-party reviews, including The Journal of Financial Economics, on our more reliable fundamental data, historically and prospectively, across all stocks, click here and here.
[3] March 23, 2021 is earliest date for which all the 2020 10-Ks for the NC 2000 constituents were available.