
Return on invested capital (ROIC) rose to its highest level since 1998 for the NC 2000[1] in 2Q22. Seven sectors in the NC 2000 saw a year-over-year (YoY) improvement in ROIC as well. This improvement comes from increases in both net operating profit after-tax (NOPAT) margins and invested capital turns.
This report is an abridged and free version of All Cap Index & Sectors: ROIC Remains Inflated in 2Q22, one of our quarterly reports on fundamental market and sector trends, available to Pro and higher members or can be purchased here.
The full version of this report analyzes[2],[3] the drivers of economic earnings [ROIC, NOPAT margin, invested capital turns, and weighted average cost of capital (WACC)] for the NC 2000, our All Cap Index, and each of its sectors (last quarter’s analysis is here).
This report leverages our cutting-edge Robo-Analyst technology to deliver proven-superior[4] fundamental research and support more cost-effective fulfillment of the fiduciary duty of care.
NC 2000 ROIC Rises in 2Q22
The NC 2000’s ROIC rose from 9.3% in 1Q22 to 9.4% in 2Q22. The NC 2000’s NOPAT margin was flat at 12% from 1Q22 to 2Q22, and invested capital turns rose slightly from 0.77 in 1Q22 to 0.78 in 2Q22.
Two key observations:
- As expected, inflation continues to lift margins as profits today are calculated using current prices for revenue but historic prices for cost of goods sold. This effect lasts while inflation runs hot but reverses as soon as inventory costs begin to outpace prices charged to customers.
- WACC has increased by less than the yields for AAA corporate bonds over the past year. That lag implies firms have shortened the maturities of their outstanding bonds to benefit from the steepness of the yield curve for maturities shorter than five years. Shortening maturities might lower the cost of debt and WACC in the near term, but it leaves firms exposed to sharply rising financing costs if interest rates keep rising.
The “record” return on capital is a mirage and the bullish trend in ROIC could reverse soon, as we already saw with the ROIC from seven sectors that fell quarter-over-quarter in 2Q22.
Key Details on Select NC 2000 Sectors
The Energy sector performed best in the second quarter of 2022 as measured by change in ROIC, with its ROIC rising 266 basis points. In the first half of 2022, energy companies benefited from high energy prices and strong economic activity, but those two factors can only travel together for so long before inflation ruins the party. That process is playing out in the third quarter as high energy prices fuel calls for tighter monetary policy and fears of recession.
The biggest loser in the second quarter had previously been among the biggest winners of the COVID-era market. ROIC for the Technology sector experienced a quarterly decline of 71 basis points in 2Q22.
Below, we highlight the Industrial sector, which had the second largest QoQ change in ROIC in 2Q22.
Sample Sector Analysis[5]: Industrials
Figure 1 shows the Industrials sector ROIC rose from 7.3% in 1Q22 to 7.6% in 2Q22. The Industrials sector NOPAT margin rose from 9.0% in 1Q22 to 9.3% in 2Q22, while invested capital turns remained flat QoQ at 0.82 in 2Q22.
Figure 1: Industrials ROIC vs. WACC: Dec 1998 – 8/12/22
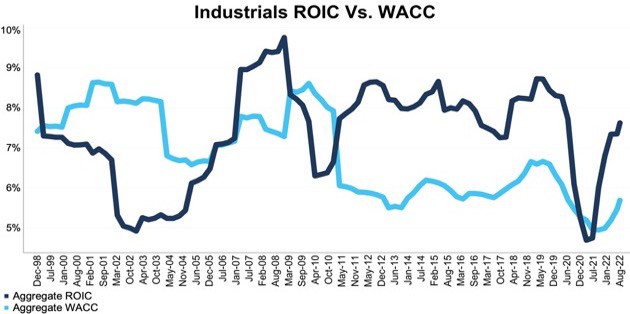
Sources: New Constructs, LLC and company filings.
The August 12, 2022 measurement period uses price data as of that date for our WACC calculation and incorporates the financial data from 2Q22 10-Qs for ROIC, as this is the earliest date for which all the 2Q22 10-Qs for the NC 2000 constituents were available.
Figure 2 compares the trends in NOPAT margin and invested capital turns for the Industrials sector since December 1998. We sum the individual NC 2000/sector constituent values for revenue, NOPAT, and invested capital to calculate these metrics. We call this approach the “Aggregate” methodology.
Figure 2: Industrials NOPAT Margin vs. IC Turns: Dec 1998 – 8/12/22
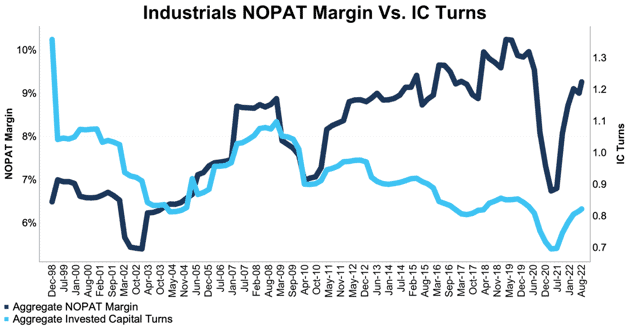
Sources: New Constructs, LLC and company filings.
The August 12, 2022 measurement period uses price data as of that date for our WACC calculation and incorporates the financial data from 2Q22 10-Qs for ROIC, as this is the earliest date for which all the 2Q22 10-Qs for the NC 2000 constituents were available.
The Aggregate methodology provides a straightforward look at the entire sector, regardless of market cap or index weighting and matches how S&P Global (SPGI) calculates metrics for the S&P 500.
For additional perspective, we compare the Aggregate method for ROIC with two other market-weighted methodologies: market-weighted metrics and market-weighted drivers. Each method has its pros and cons, which are detailed in the Appendix.
Figure 3 compares these three methods for calculating the Industrials sector’s ROICs.
Figure 3: Industrials ROIC Methodologies Compared: Dec 1998 – 8/12/22
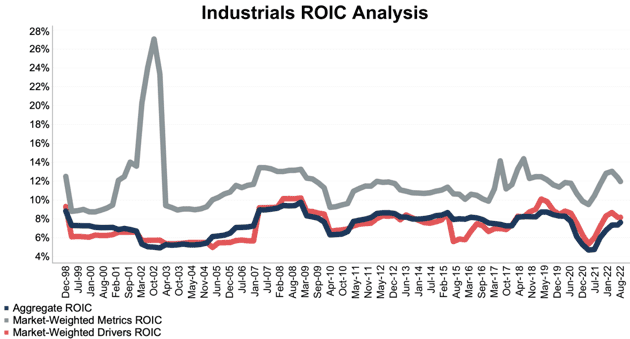
Sources: New Constructs, LLC and company filings.
The August 12, 2022 measurement period uses price data as of that date for our WACC calculation and incorporates the financial data from 2Q22 10-Qs for ROIC, as this is the earliest date for which all the 2Q22 10-Qs for the NC 2000 constituents were available.
This article originally published on August 30, 2022.
Disclosure: David Trainer, Kyle Guske II, Matt Shuler, and Brian Pellegrini receive no compensation to write about any specific stock, style, or theme.
Follow us on Twitter, Facebook, LinkedIn, and StockTwits for real-time alerts on all our research.
Appendix: Analyzing ROIC with Different Weighting Methodologies
We derive the metrics above by summing the individual NC 2000/sector constituent values for revenue, NOPAT, and invested capital to calculate the metrics presented. We call this approach the “Aggregate” methodology.
The Aggregate methodology provides a straightforward look at the entire sector, regardless of market cap or index weighting and matches how S&P Global (SPGI) calculates metrics for the S&P 500.
For additional perspective, we compare the Aggregate method for ROIC with two other market-weighted methodologies:
- Market-weighted metrics – calculated by market-cap-weighting the ROIC for the individual companies relative to their sector or the overall NC 2000 in each period. Details:
- Company weight equals the company’s market cap divided by the market cap of the NC 2000/its sector
- We multiply each company’s ROIC by its weight
- NC 2000/Sector ROIC equals the sum of the weighted ROICs for all the companies in the NC 2000/each sector
- Market-weighted drivers – calculated by market-cap-weighting the NOPAT and invested capital for the individual companies in the NC 2000/each sector in each period. Details:
- Company weight equals the company’s market cap divided by the market cap of the NC2000/its sector
- We multiply each company’s NOPAT and invested capital by its weight
- We sum the weighted NOPAT and invested capital for each company in the NC 2000/each sector to determine the NC 2000/sector’s weighted NOPAT and weighted invested capital
- NC 2000/Sector ROIC equals weighted NC 2000/sector NOPAT divided by weighted NC 2000/sector invested capital
Each methodology has its pros and cons, as outlined below:
Aggregate method
Pros:
- A straightforward look at the entire NC 2000/sector, regardless of company size or weighting.
- Matches how S&P Global calculates metrics for the S&P 500.
Cons:
- Vulnerable to impact of by companies entering/exiting the group of companies, which could unduly affect aggregate values despite the level of change from companies that remain in the group.
Market-weighted metrics method
Pros:
- Accounts for a firm’s size relative to the overall NC 2000/sector and weights its metrics accordingly.
Cons:
- Vulnerable to outsized impact of one or a few companies. This outsized impact tends to occur only for ratios where unusually small denominator values can create extremely high or low results.
Market-weighted drivers method
Pros:
- Accounts for a firm’s size relative to the overall NC 2000/sector and weights its NOPAT and invested capital accordingly.
- Mitigates potential outsized impact of one or a few companies by aggregating values that drive the ratio before calculating the ratio.
Cons:
- Can minimize the impact of period-over-period changes in smaller companies, as their impact on the overall sector NOPAT and invested capital is smaller.
[1] The NC 2000 consists of the largest 2000 U.S. companies by market cap in our coverage. Constituents are updated on a quarterly basis (March 31, June 30, September 30, and December 31). We exclude companies that report under IFRS and non-U.S. ADR companies.
[2] Calculated using SPGI’s methodology, which sums individual NC 2000 constituent values for NOPAT and invested capital. See Appendix III for more details on this “Aggregate” method and Appendix I for details on how we calculate WACC for the NC 2000 and each of its sectors.
[3] This report is based on the latest audited financial data available, which is the 2Q22 10-Q in most cases. Price data as of 8/12/22.
[4] Our research utilizes our Core Earnings, a more reliable measure of profits, as proven in Core Earnings: New Data & Evidence, written by professors at Harvard Business School (HBS) & MIT Sloan and published in The Journal of Financial Economics.
[5] The full version of this report provides the same analysis for all eleven sectors.