
Have you ever bought a grab bag of items, and upon finding what’s inside, feel nothing but disappointment?
Investing in ETFs and mutual funds can create a similar feeling. You buy a fund based on its stated methodology or even its top 10 holdings, only to find disappointment when it underperforms.
Fund investing doesn’t have to be a grab-bag purchase! There is a better way.
Similar to stock picking, investors can find quality funds if they conduct proper due diligence. Our fund ratings are based on analyzing all the holdings of a fund, not past performance. After all, the stocks in a fund drive its performance.
After highlighting a bad fund earlier this week, we present the opposite: a mutual fund that offers Very Attractive Risk/Reward.
This week’s Long Idea is a fund that focuses on fundamentals, with a focus on free cash flow. The fund identifies profitable businesses that trade at prices much cheaper than the stocks held in its respective benchmark. Importantly, it does so while charging below average fees.
We think it’s best to evaluate a fund based on research on each of its holdings. This bottom-up approach is more forward-looking than legacy fund ratings, like Morningstar. Given the outperformance of stock picks (more below) we think our bottom-up fund research merits your attention.
After all, the stocks in a fund drive its performance.
After analyzing our ratings on the 7,100+ ETFs and mutual funds we cover, we found a mutual fund that picks stocks with strong fundamentals and cheap valuations while charging below-average fees.
Beutel Goodman Large-Cap Value Fund (BVALX) is this week’s Long Idea.
Backwards Looking Research Underrates This Fund
While legacy fund research is backward-looking, our fund research is forward-looking and based on proven-superior fundamental analysis on each individual holding.
When viewed through our Predictive Risk/Reward Fund Rating methodology, BVALX earns a Very Attractive rating. Meanwhile, Morningstar gives the fund a 2 Star rating.
BIAVX, the other share class of the mutual fund also earns a Very Attractive rating while Morningstar rates it 3 Stars. See Figure 1.
Figure 1: Beutel Goodman Large-Cap Value Fund Ratings

Sources: New Constructs, LLC, company filings, mutual fund filings, and Morningstar
Higher quality holdings and lower average costs mean Beutel Goodman Large-Cap Value Fund is more likely to outperform in the future, which is something traditional fund research can’t tell you.
How Our Forward-Looking Research Reveals a Very Attractive Fund
Our analysis of Beutel Goodman Large Cap Value Fund’s holdings reveals the fund allocates more to high-quality stocks, i.e. profitable companies with undervalued stock prices, than its benchmark, iShares Russell 1000 Value ETF (IWD). See Figure 2.
We leverage our Robo-Analyst AI Agent[1] to assess a mutual fund’s portfolio quality by analyzing the fund’s individual stock holdings.
Through this rigorous analysis, we find that BVALX allocates 31% of its assets to Attractive-or-better rated stocks compared to just 15% for IWD. On the flip side, BVALX allocates just 14% of its assets to Unattractive-or-worse rated stocks compared to 37% for IWD.
Figure 2: BVALX Holdings Vs. IWD Holdings
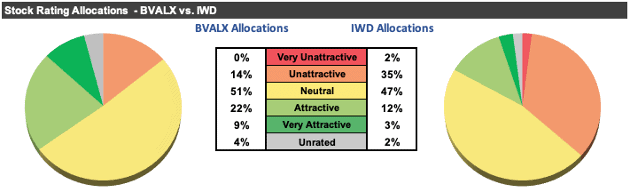
Sources: New Constructs, LLC, company, ETF, and mutual fund filings
Per Figure 3, our holdings analysis also reveals BVALX’s portfolio is of much higher quality than the S&P 500, as represented by State Street SPDR S&P 500 ETF Trust (SPY). SPY earns our Attractive rating, but only 7% of its portfolio is allocated to stocks rated Attractive-or-better while 43% is allocated to stocks rated Unattractive-or-worse.
Figure 3: BVALX Holdings Vs. SPY Holdings
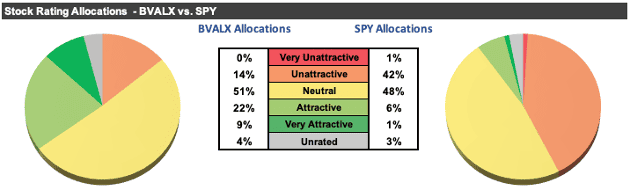
Sources: New Constructs, LLC, company, ETF, and mutual fund filings
Fund Managers Focus on Cash Flows
BVALX’s investment strategy invests in “companies at discounts to their business value, which the Fund considers to be the present value of sustainable free cash flow.”
The fund managers use “a bottom-up, fundamental approach” to identify companies that “create shareholder value through sustainable free cash flow generation.” The managers combine this analysis with a focus on “quality, growing companies with strong balance sheets…”
We applaud the focus on fundamentals, and particularly free cash flow, in BVALX’s stock picking. 2-year average free cash flow yield is one of the five metrics that make up our Stock Ratings, so we appreciate a focus on cash flows.
We would love more details or calculations behind these metrics and what the fund refers to as “internally-generated fundamental research”, but as it stands, we can only judge the methodology by its results, or the stocks the fund allocates too.
Given the fund’s superior asset allocation (compared to its benchmark and the SPY), it’s clear the investment strategy successfully finds stocks that provide quality risk/reward, as we’ll detail below.
Quality Stocks Drive Very Attractive Risk/Reward Rating
Figure 4 shows our detailed rating for BVALX, which includes each of the criteria we use to rate all mutual funds under coverage. These criteria are the same for our Stock Rating Methodology, because the performance of a mutual fund’s holdings drives the performance of the mutual fund after fees. Figure 4 also compares BVALX’s rating with those of IWD, SPY and IWM.
Figure 4: Beutel Goodman Large-Cap Value Fund Breakdown
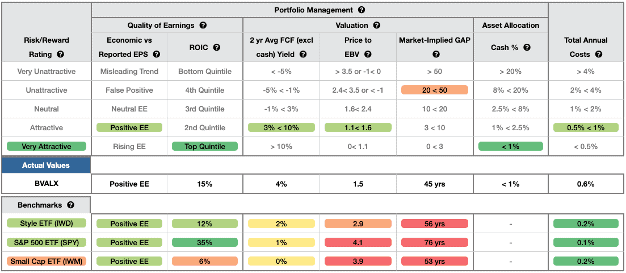
Sources: New Constructs, LLC and company filings
BVALX’s holdings are superior or equal to IWD in all five of the criteria (and four out of five vs. SPY) that make up our Portfolio Management rating. Specifically:
- BVALX’s holdings generate positive economic earnings, same as IWD and SPY.
- BVALX ROIC is 15%, which is higher than IWD’s at 12%.
- BVALX’s free cash flow (FCF) yield of 4% is higher than IWD’s at 2% and SPY’s at 1%.
- The price-to-economic book value (PEBV) ratio for BVALX’s holdings is 1.5, which is much lower (better) than IWD’s at 2.9 and SPY’s at 4.1.
- Our discounted cash flow analysis reveals an average market-implied growth appreciation period (GAP) of 45 years for BVALX’s holdings compared to 56 years for IWD and 76 years for SPY.
The takeaway?
BVALX allocates to profitable businesses, as measured by the 15% ROIC of its holdings, which trade at prices that are much cheaper than the stocks held in the benchmark, as measured by its lower PEBV ratio and market-implied GAP.
A Closer Look at Holdings Reveals More Positives
Of the 28 BVALX holdings in our coverage universe, 4 are also open Long Ideas of ours. These 4 stocks make up nearly 15% of BVALX’s portfolio.
Also, of the 28 holdings under coverage:
- 100% have a positive ROIC,
- 89% have a positive 2-year average free cash flow yield,
- 96% have a positive PEBV ratio of 2.9 (equal to benchmark) or less, and
- 64% have a GAP of 56 years (equal to benchmark) or less.
Quality Stock Selection at Below Average Cost
BVALX’s 0.61% total annual costs (TAC) are below the 1.77% simple average and 0.91% asset-weighted average of the Large Cap Value mutual funds for which we have assets data under coverage. Figure 5 shows our breakdown of BVALX’s total annual costs, which is available for all 7,100+ mutual funds and ETFs under coverage.
Figure 5: BVALX’s Total Annual Costs Breakdown
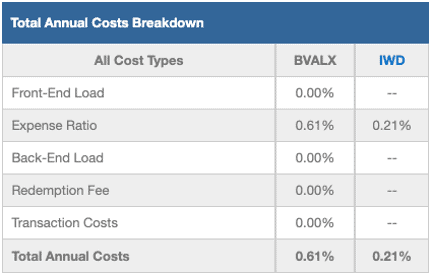
Sources: New Constructs, LLC and company filings
The Importance of Holdings Based Fund Analysis
We offer clients in-depth reports for all the 7,100+ ETFs and mutual funds under coverage. Click below for a free copy of our standard mutual fund report on BVALX.
Smart fund (or ETF) investing means analyzing each of the holdings of a fund. Simply buying an ETF or mutual fund based on past performance does not necessarily lead to outperformance. Only thorough holdings-based research can help determine if a fund’s methodology leads managers to pick high-quality or low-quality stocks.
Most investors don’t realize they can access superior fundamental research that enables them to overcome inaccuracies, omissions, and biases in legacy fundamental research and data. Our Robo-Analyst technology analyzes the holdings of all 1,141 ETFs and mutual funds in the Large Cap Value style and ~7,100+ ETFs and mutual funds under coverage to avoid “the danger within”.
Build A Better Fund: Use our DIY ETF Tool
As we show in The Paradigm Shift to DIY ETFs, new technologies enable investors to create their own fund without any fees while also enabling better, more sophisticated weighting methodologies. For example, if we reallocate the fund’s capital to the companies with the best Core Earnings, our customized fund allocates:
- 45% of assets to Attractive-or-better rated stocks (compared to 31% for BVALX)
- 8% of assets to Unattractive-or-worse rated stocks (compared to 14% for BVALX)
Compare the quality of stock allocation in as-is BVALX vs. our custom version of BVALX in Figure 6.
Figure 6: BVALX Vs. Custom Fund Allocations
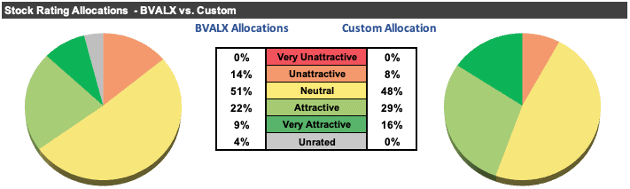
Sources: New Constructs, LLC and company filings
Note that our DIY ETF tool allows clients to pick and weight portfolio holdings based on multiple proprietary metrics, such as, ROIC, Economic Earnings, Free Cash Flow, Net Operating Profit After Tax and more.
Check Out the Indices Based on New Constructs Research
While we’re writing about creating your own fund, we should highlight the indices we’ve developed with Bloomberg’s Index Licensing Group. All three outperformed the S&P 500 over the past five years. See Figures 7-9.
- Bloomberg New Constructs Core Earnings Leaders Index (ticker: BCORET:IND)
- Bloomberg New Constructs Ratings VA-1 Index (ticker: BNCVA1T:IND)
- Bloomberg New Constructs 500 Index (ticker: B500NCT:IND)
The Bloomberg New Constructs Core Earnings Leaders Index beat the S&P 500 by 44% over the past five years. The Index (ticker: BCORET:IND) was up 137% while the S&P 500 was up 92%. See Figure 7 for details.
Figure 7: Bloomberg New Constructs Core Earnings Leaders Index Outperforms the S&P 500
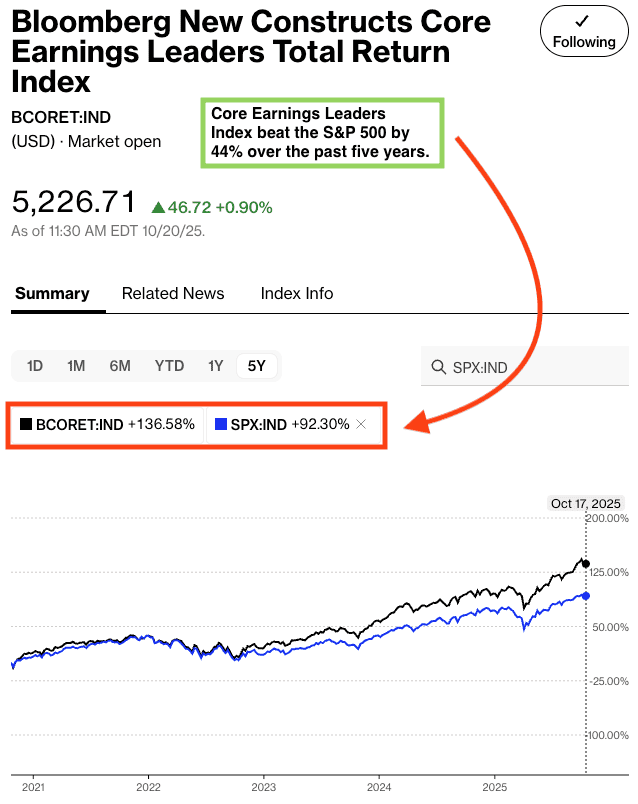
Sources: Bloomberg as of October 17, 2025
Note: Past performance is no guarantee of future results.
The “Very Attractive Stocks” Index beat the S&P 500 by 52% over the past five years. Bloomberg’s official name for the index is Bloomberg New Constructs Ratings VA-1Index (ticker: BNCVAT1T:IND). Figure 8 shows it was up 145% while the S&P 500 was up 92%.
Figure 8: Very Attractive-Rated Stocks Strongly Outperform the S&P 500
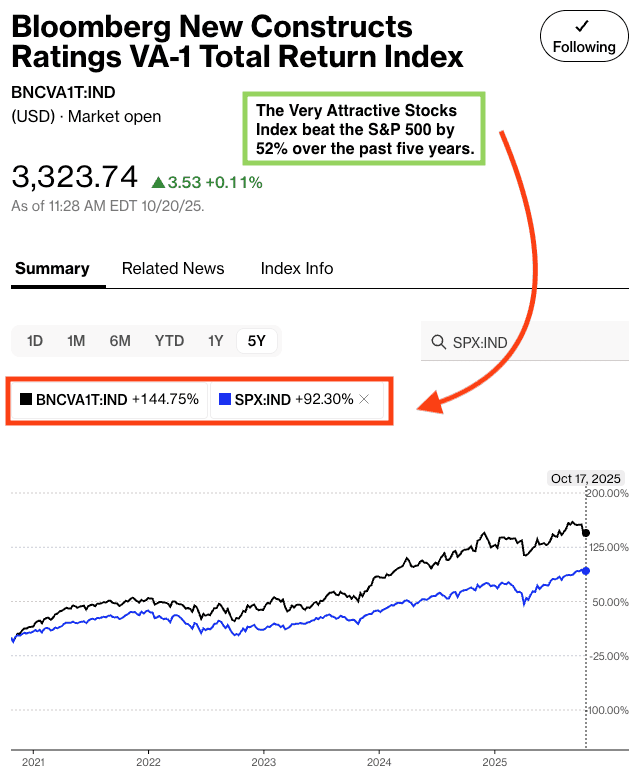
Sources: Bloomberg as of October 17, 2025
Note: Past performance is no guarantee of future results.
Our “Core-Earnings Weighted S&P 500” Index beat the S&P 500 by 30% over the past five years. Bloomberg’s official name for the index is Bloomberg New Constructs 500 Total Return Index (ticker: BNCVAT1T:IND). Figure 9 shows it was up 122% while the S&P 500 was up 92%.
Figure 9: Bloomberg New Constructs 500 Index Strongly Outperforms the S&P 500
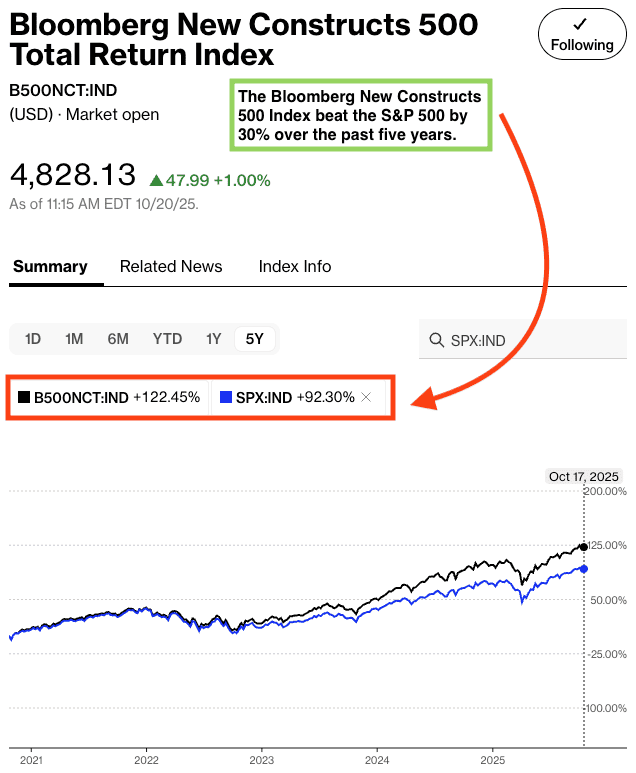
Sources: Bloomberg as of October 17, 2025
Note: Past performance is no guarantee of future results.
This article was originally published on October 22, 2025.
Disclosure: David Trainer, Kyle Guske II, and Hakan Salt receive no compensation to write about any specific stock, style, or theme.
Questions on this report or others? Join our online community and connect with us directly.
[1] Our Robo-Analyst AI Agent provides superior fundamental data, as proven in The Journal of Financial Economics, and a novel source of alpha.