
We published an update on this Danger Zone pick on August 17, 2022. A copy of the associated report is here.
We counsel investors to take care not to be cut by falling knives – stocks that have seen steep declines but still have further to fall. As the market rotates away from high-flying growth names to more stable cash generators, investors need reliable fundamental research, more than ever, to protect their portfolios from falling knives.
We continue to post an exceptional hit rate on spotting overvalued stocks. Currently, 62 out of our 65 Danger Zone stock picks are down from their 52-week highs by more than the S&P 500. Figure 1 lists the open Danger Zone picks that are down at least 40% from their 52-week highs. Our Focus List Stocks: Short Model Portfolio, the best-of-the-best of our Danger Zone picks, outperformed the S&P 500 as a short portfolio by 36% in 2021 with 29 out of our 31 picks outperforming the index.
This report highlights one particularly dangerous falling knife: Uber (UBER: $35/share). We highlight four other falling knives in other reports published today: Affirm (AFRM: $60/share) here, Rivian (RIVN: $60/share) here, DoorDash (DASH: $104/share) here, and Warby Parker (WRBY: $35/share) here. Each of these stocks have dropped at least 40% from all-time highs, yet still carry at least 40% additional downside risk.
Figure 1: Danger Zone Picks Down >40% From 52-Week High – Performance through 1/28/22
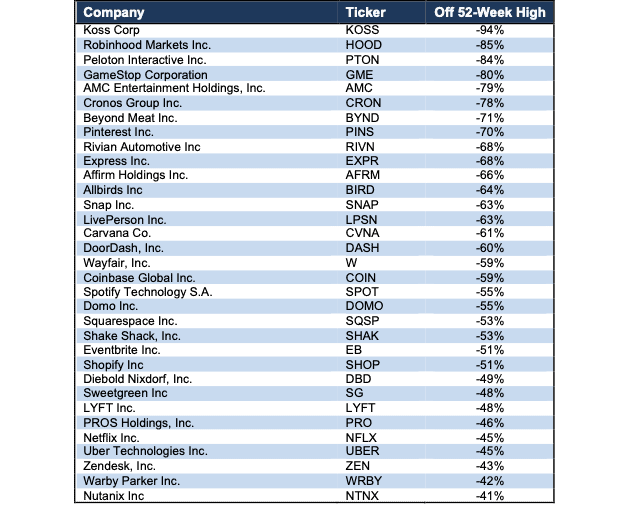
Sources: New Constructs, LLC
Falling Knife: Uber Technologies (UBER): Down 45% from 52-Wk High & 49%+ Downside Remaining
We named Uber (UBER) one of the most dangerous stocks for fiduciaries in August 2020 when we reiterated our original Danger Zone report from April 2019. Since our original report, Uber has outperformed the S&P 500 as a short by 69% and could fall another 49%. We detail Uber’s broken business model, the commoditized nature of its industry, and more challenges facing the company in our most recent report here.
Current Price Is So Overvalued that it Implies Uber Owns 123% of 2030 TAM
Below, we use our reverse discounted cash flow (DCF) model to analyze the expectations for future growth in cash flows baked into Uber’s current share price and show that it could fall 49%+ further.
To justify its current price of $35/share, Uber must immediately:
- Improve its pre-tax margin to 4% (compared to -34% TTM), which is similar to airlines prior to consolidation and
- grow revenue by 33% compounded annually for the next 10 years.
In this scenario, Uber would earn $189 billion in revenue in 2030. At its 3Q21 take rate of 21%, this scenario equates to over $901 billion in gross bookings in 2030.
In other words, to justify its current stock price, Uber must capture 123% of the combined projected TAM[1] for rideshare and food delivery in 2030. For reference, Second Measure estimates Uber’s share of the U.S. rideshare TAM is 70% in December 2021 and its share of the U.S. food delivery TAM sits at 27% (including acquired Postmates) in December 2021.
Keep in mind, the number of companies that grow revenue by 20%+ compounded annually for such a long period are unbelievably rare, making the expectations in Uber’s share price outright unrealistic.
49% Downside Even if Uber Meets Industry Growth
Uber’s economic book value, or no growth value, is negative $40/share, which illustrates the overly optimistic expectations in its stock price.
Even if we assume Uber:
- improves its pre-tax margin to 6% (greater than pre-consolidation airlines) and
- grows revenue by 19% compounded annually (equal to projected rideshare market CAGR through 2026) through 2030, then
the stock is worth just $18/share today – a 49% downside. Even in this scenario, Uber would earn $65 billion in revenue in 2030. At its 3Q21 take rate, this scenario equates to over $310 billion in gross bookings in 2030.
This scenario may even prove too optimistic as it assumes a significant improvement in NOPAT margin in an industry with little pricing power due to the abundance of alternatives, in which case the downside to the stock would be even larger.
Figure 2 compares Uber’s implied future gross bookings in these scenarios to its historical gross bookings, along with the expected TAM for rideshare and food delivery in 2030.
Figure 2: Uber’s Historical and Implied Bookings: DCF Valuation Scenarios
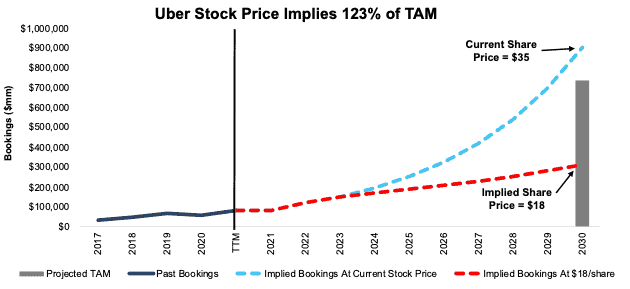
Sources: New Constructs, LLC and company filings.
Each of the above scenarios also assumes UBER is able to grow revenue, NOPAT, and FCF without increasing working capital or fixed assets. This assumption is highly unlikely but allows us to create best-case scenarios that demonstrate how high the expectations embedded in the current valuation are. For reference, UBER’s invested capital has increased by $5.1 billion (36% of TTM revenue) over the trailing-twelve-months (TTM) and by an average of $5.8 billion (42% of TTM revenue) over the past three years.
Fundamental Research Provides Clarity in Frothy Markets
2022 has quickly shown investors that fundamentals matter and stocks don’t only go up. With a better grasp on fundamentals, investors have a better sense of when to buy and sell – and – know how much risk they take when they own a stock at certain levels. Without reliable fundamental research, investors have no way of gauging whether a stock is expensive or cheap.
As shown above, disciplined, reliable fundamental research shows that even after plummeting, Uber, Affirm, Rivian, DoorDash, and Warby Parker still hold significant downside.
Check out this week’s Danger Zone interview with Chuck Jaffe of Money Life.
This article originally published on January 31, 2022.
Disclosure: David Trainer, Kyle Guske II, and Matt Shuler receive no compensation to write about any specific stock, style, or theme.
Follow us on Twitter, Facebook, LinkedIn, and StockTwits for real-time alerts on all our research.
[1] 2030 TAM estimate equals a $423 billion global ridesharing market and $312 billion global food delivery market. Global ridesharing TAM assumes the global rideshare market continues growing at 19.2% annually from 2026-2030 (consistent with Mordor Intelligence’s estimated CAGR through 2026). Global food delivery TAM assumes the global food delivery market continues growing at 10.9% annually from 2028-2030 (consistent with Research and Market’s estimated CAGR through 2028).