
Check out this week’s Danger Zone interview with Chuck Jaffe of Money Life.
We first warned investors about Uber’s unrealistic valuation before its IPO in April 2019: “Uber’s IPO Valuation Makes No Sense.” After an underwhelming IPO and its firsts earnings report as a public company, we warned again in “Uber Gives Investors the Worst of Both Worlds.” Now, with the stock trading 33% below its IPO price, and the firm feeling the brunt of the COVID-19 shutdowns across the world, some investors may think there is value in Uber. Think again. Uber (UBER: $30/share) is this week’s Danger Zone pick.
We think those with fiduciary responsibilities need to consider just how much risk they take by owning UBER at current levels. This report shows investors of all types just how extreme the risk in UBER is based on:
- Recent legislation could break an already weak business model
- Delivery market share is stagnant (excluding acquisitions) and rideshare is falling
- The path to profitability remains unclear
- Doing the math: the stock is priced as if Uber will improve profitability and take 101% of the ridesharing and food delivery markets
Broken Business if Judge Decides to Enforce AB-5
Uber (along with Lyft (LYFT)) have built their businesses by selling rides and deliveries below cost to gain market share, all the while classifying drivers as contractors in order to avoid paying full benefits and keep costs lower.
A San Francisco judge recently ordered the companies to comply with California law AB-5 and classify drivers as employees. As the Financial Times recently noted on the ruling: “it seems the jig is up.”
An appeals court already extended the length of time Uber has to comply with the order, but Uber must now submit a sworn statement that they have a plan to comply with the law if the appeals court affirms the injunction. Perhaps this statement will be different than mid-2019, when Uber went so far as to claim drivers “aren’t an essential part of its business” as reason for why the firm would not comply with the law, an argument akin to saying wheels aren’t an essential part of a car.
Beyond the fact that classifying drivers as employees would create additional labor costs (Uber drivers total ~209k in California) for an already unprofitable business, Uber’s response to the ruling (and other long-held disputes over its classification of drivers) provides great insights into how the firm views drivers and their place in the firm’s path to profitability.
Rather than comply with the law, Uber announced it would consider suspending service in California (and Lyft actually suspended service before reversing course after the appeals court ruling) if forced to comply. In other words, Uber and Lyft are explicitly admitting that they prefer (at least in the short-term) to cease operations in some of the largest markets (San Francisco and Los Angeles are two of the five metropolitan areas that made up 23% of Uber’s mobility gross bookings in 2019) than to classify drivers as employees, incur higher costs, and lose even more money.
Should AB-5 remain in effect, Uber is faced with two options, and neither can please all stakeholders, i.e. shareholders and consumers/employees. (1) if Uber increases ride and delivery costs to offset labor costs, it risks losing market share to other firms and traditional forms of transportation. (2) If Uber maintains low prices and absorbs the increased labor costs, the path to profitability becomes even harder to imagine.
Thus far, it seems management doesn’t want to classify drivers as employees. However the firm proceeds, it has almost no chance of achieving the future profit growth expectations implied by its stock price, as we’ll show later.
Competitors Are Ready to Fill the Void and Take Market Share
Should Uber decide to suspend service in California, there are a multitude of competitors that would be willing to fill their shoes, in large part due to the low barriers to entry in the ridesharing market. CNBC reports that Alto, which already utilizes an employee-based business model, and Arcade City are accelerating their plans to enter the California market.
Additionally, the absence of Uber and Lyft would allow traditional taxi services more room to operate and reclaim lost market share. Because Uber’s only competitive advantage to date is raising lots of money, plenty of competitors stand ready to take its place in California and other markets.
Uber’s Market Share Is Falling…
As noted in our original article, Uber’s market share of the U.S. rideshare market is in decline. The firm held approximately 82% of the U.S. rideshare market at the beginning of 2017 and has fallen to 70% in July 2020. While still the market leader, Uber’s growth at all costs approach, without any market share gains, leaves investors, ultimately, holding the bag for management’s poor capital allocation.
On the food delivery side, market share has largely stagnated, except for the recent acquisition of Postmates. Data analytics firm Second Measure estimated Uber Eats held 22% of the U.S. food delivery market in 2018. In July 2020, Uber Eats’ market share was estimated at 23%. Direct competitor DoorDash increased its market share from 19% to 46% over the same time. Figure 1 illustrates the market share gains/losses by the main U.S. food delivery services since 2018.
Figure 1: U.S. Food Delivery Market Share: 2018 – July 2020
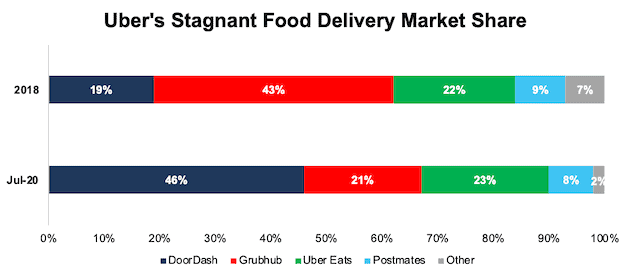
Sources: New Constructs, LLC, and Second Measure
… As It Incurs Massive Losses
Uber has grown revenue by 34% compounded annually since 2017 with little regard for generating profits. Uber’s core earnings[1] have fallen from -$4.1 billion in 2017 to -$4.8 billion over the trailing-twelve-months (TTM).
Core earnings remove unusual gains and expenses included in GAAP net income. To get the full picture of Uber’s operations and hold management accountable for capital allocation, we also analyze balance sheets to calculate an accurate ROIC and economic earnings.
Some notable adjustments to UBER’s balance sheet include:
- Added $2.6 billion in accumulated asset write-downs
- Added $1 billion in operating leases
- Added $644 million in accumulated other comprehensive loss
After all adjustments, we find that Uber’s economic earnings have fallen from -$4.6 billion in 2017 to -$6.3 billion TTM, per Figure 2.
Figure 2: Uber’s Core & Economic Earnings: 2017 - TTM
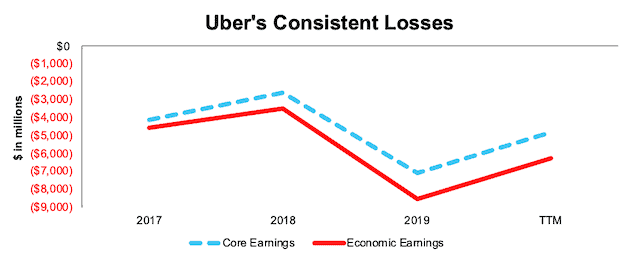
Sources: New Constructs, LLC, and company filings
Uber’s ability to raise money is, indeed, an important skill because the firm has a history of significant free cash flow (FCF) burn that is unlikely to change anytime soon. Over the past two years, the firm has burned a cumulative $23.3 billion (42% of market cap) in FCF. What’s worse, the firm’s annual FCF burn is accelerating. Uber burned $9.7 billion in FCF in 2018 and $13.7 billion in 2019. At the end of 2Q20, Uber had $7.8 billion of cash and cash equivalents and short-term investments on its balance sheet. At its TTM FCF burn rate of -$4 billion, the firm has enough cash to operate for just over 23 months before running out or needing additional capital infusion.
Negative Profitability Is the Norm in the Industry…
Uber’s losses are well known, and, largely the norm in the rideshare and food delivery market, as evidenced by Figure 2. However, the firm’s profitability is getting worse. Uber’s NOPAT margin has fallen from -19% in 2018 to -33% TTM.
Uber’s capital efficiency ranks below both GrubHub (GRUB) and Lyft and has worsened in recent years. The firm’s invested capital turns, a measure of balance sheet efficiency, fell from 0.7 in 2018 to 0.5 TTM. Lyft and GrubHub improved their respective invested capital turns over the same time.
Negative and falling margins and declining invested capital turns drive Uber’s already negative return on invested capital (ROIC) even lower. Uber’s ROIC has fallen from -12% in 2018 to -16% TTM. See Figure 3.
Figure 3: Uber’s Negative Profitability in Profitless Industry
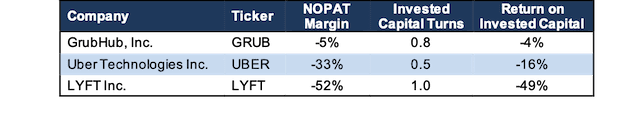
Sources: New Constructs, LLC, and company filings
Economies of Scale Are Far Off
The primary goal for a firm aggressively taking market share while losing money is to achieve economies of scale. In theory, Uber could cut expenses, such as R&D and sales & marketing, to become instantly profitable. However, due to the low barriers to entry, and numerous competitors operating with the same mindset, this scenario is increasingly unlikely.
Unfortunately for Uber, the first firm to try to achieve profitability will likely lose market share to firm’s that continue providing the service below cost until the profitable firm’s market share erodes.
Figure 4 shows Uber’s operating expenses as a percent of revenue rose from 73% in 2018 to 83% TTM. For all the talk about the firm’s revenue growth and large market share, its operating expenses are growing even faster. Since 2017, Uber’s operating expenses have grown 43% compounded annually as revenue has grown by only 34% compounded annually. In other words, as Uber gets bigger, its business loses more money.
Figure 4: Uber’s Operating Expenses as a Percent of Revenue Since 2017
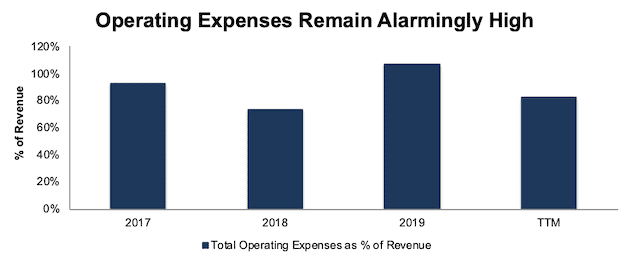
Sources: New Constructs, LLC and company filings.
Take Rate on the Decline Again
As noted in our original article, Uber’s take rate, the percentage of gross bookings it captures as revenue, was, and remains, in steady decline. Uber’s take rate reached 20.5% in 2Q20, compared to 22.2% in 1Q18. In other words, Uber is generating less revenue per booking as competition rises and drivers demand higher wages or additional incentives to join the platform.
Uber’s declining take rates and falling market share showcase the key problem with the business: it has no real competitive advantage that will allow it to earn a profit. Uber can’t achieve profitability without squeezing drivers or customers, but if it squeezes either, it will lose market share.
Instead, the firm is spending more money to attract riders and pay drivers and burning billions of dollars.
Figure 5: Uber’s Take Rate: Q1’18 – Q2’20
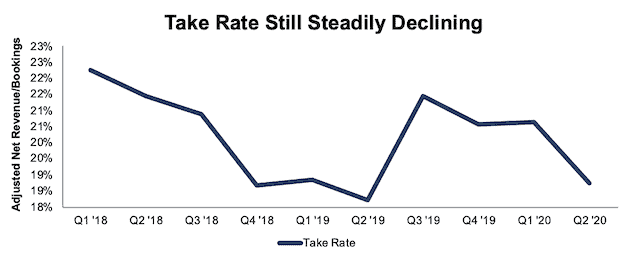
Sources: New Constructs, LLC and company filings.
Autonomous Driving Is No Solution, At Least Any Time Soon
Self-driving cars are often presented as the silver bullet that will turn ridesharing platforms into profitable enterprises. However, as we’ve pointed out in recent reports on Tesla (TSLA), PACCAR Inc. (PCAR), and General Motors (GM), truly autonomous vehicles are many years away from being a viable solution.
In the interim, vehicles will be equipped with differing levels of automation, all of which will require a driver to be present, even if they’re not operating the vehicle at all times. In this scenario, the driver costs, whether contractors or employees, aren’t going away.
In any case, self-driving cars are not a panacea for profits for Uber. They will not lower costs. Instead, they shift the costs of paying drivers to renting or buying vehicles. If Uber cannot rely on its drivers’ cars, then the firm has to buy or rent its own cars. Renting cars would likely not be much cheaper, if at all, than paying drivers for their cars. Buying cars means high upfront capital costs plus ongoing maintenance and insurance costs. Either way, autonomously driven cars will not come cheap.
Doing the Math: Valuation Implies More Market Share than Is Available
With declining take rates, already negative profitability, and the first economic recession in Uber’s history, we think shares can fall much further. When we use our reverse discounted cash flow (DCF) model to analyze the expectations implied by the stock price, UBER appears significantly overvalued.
To justify its current price of $30/share, Uber must immediately improve its pre-tax margin to 4% (compared to -33% TTM) which is similar to airlines prior to consolidation and grow revenue by 26% compounded annually for the next 10 years. See the math behind this reverse DCF scenario.
In this scenario, Uber would earn nearly $57 billion in revenue in 2025 and $143 billion in 2029. At its TTM take rate, this scenario equates to ~$276 billion in gross bookings in 2025. For reference, Mordor Intelligence projects the total addressable market (TAM) for ridesharing will be $210 billion in 2025. Grand View Research projects the TAM for food delivery will be ~$64 billion in 2025, for a combined TAM of ~$273 billion.
In other words, to justify its current stock price, Uber must capture over 100% of the projected 2025 rideshare and food delivery TAMs combined, per Figure 6.
Figure 6: Current Valuation Implies Bookings Will Surpass TAM in 2025
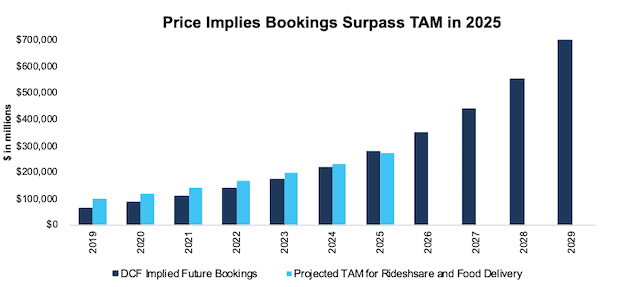
Sources: New Constructs, LLC, company filings, Mordor Intelligence, and Grand View Research.
Figure 7 compares the firm’s implied future bookings ($697 billion in 2029) in this scenario to its historical bookings, along with the expected TAM of ridesharing and food delivery in 2025.
For reference, as of July 2020, Uber holds 70% of the U.S. rideshare market and ~31% of the U.S. food delivery market, which includes the recent acquisition of Postmates.
Figure 7: Current Valuation Implies 101% Market Share in 2025
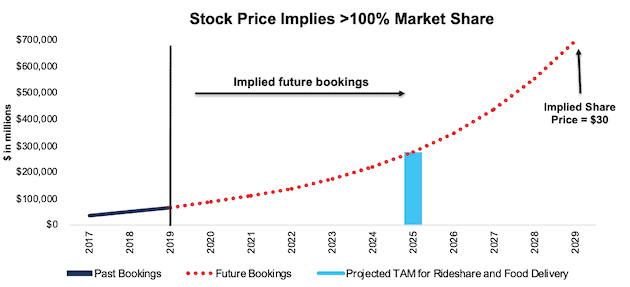
Sources: New Constructs, LLC, company filings, Mordor Intelligence, and Grand View Research.
For comparison, we compare the revenue implied by Uber’s stock price to the four largest airlines by passengers carried, per Figure 8. Uber’s current stock price implies its revenue ten years from now will be $143 billion, or just 10% below the combined 2019 revenue of Delta (DAL), American (AAL), United (UAL), and Southwest (LUV) or $158 billion.
Figure 8: Current Valuation Implies Massive Revenue Growth
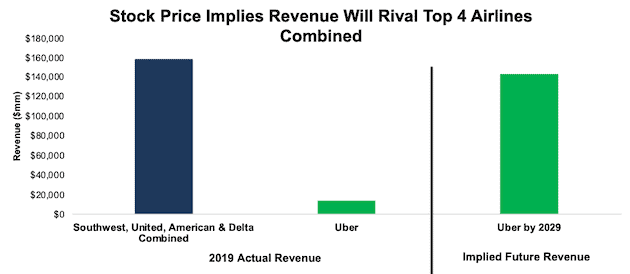
Sources: New Constructs, LLC and company filings.
Figure 9 compares the firm’s implied future NOPAT in this scenario to its historical NOPAT. In any scenario worse than this one, UBER holds significant downside risk, as we’ll show.
Figure 9: Current Valuation Implies Huge Improvement in Profitability
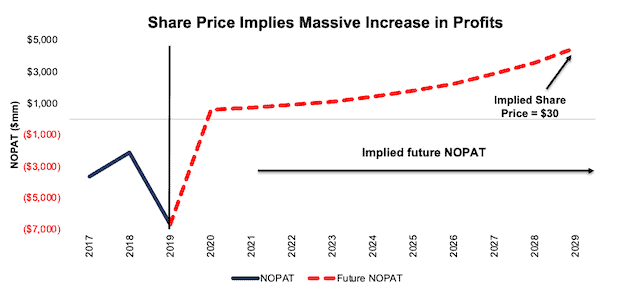
Sources: New Constructs, LLC and company filings.
Significant Downside Even in an Optimistic Scenario
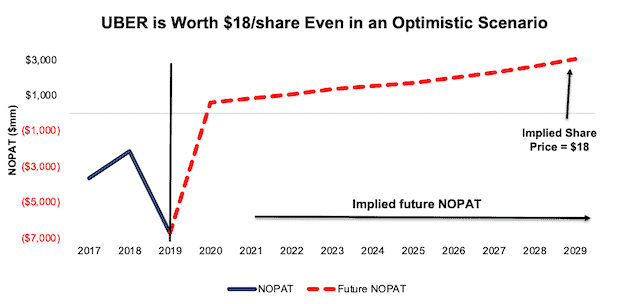
Even if we assume Uber can achieve a 6% pre-tax margin (greater than pre-consolidation airlines) and grow revenue by 16% compounded annually (in line with longer-term consensus estimates through 2025) for the next decade, the stock is worth only $18/share today – a 40% downside to the current stock price. See the math behind this reverse DCF scenario.
Figure 10 compares the firm’s implied future NOPAT in this scenario to its historical NOPAT.
Figure 10: Uber Has Large Downside Risk: DCF Valuation Scenario
Sources: New Constructs, LLC and company filings.
Each of the above scenarios also assumes UBER is able to grow revenue, NOPAT and FCF without increasing working capital or fixed assets. This assumption is highly unlikely but allows us to create best-case scenarios that demonstrate how high expectations embedded in the current valuation are. For reference, UBER’s invested capital has increased by an average of $7.2 billion (51% of 2019 revenue) over the past two years.
More Downside in a More Likely Scenario
We can’t discount the stupid money risk of a company overpaying for an acquisition, but it’s hard to build a sound fundamental case for anyone to acquire Uber at its current valuation and operational status.
We continue to believe the ceiling on Uber’s valuation is the amount of capital it took to build out its platform.
Specifically, if Uber has raised ~$25 billion in capital, and it still has ~$8 billion in cash, then why wouldn't any other potential acquirer consider $17 billion as the maximum amount it would need to build out its own rideshare business? Furthermore, now that Uber and Lyft have proven the market, it would likely be even cheaper to build out a competing business, as evidenced by the numerous startups in the market. And, if an acquirer can build its own rideshare company for $17 billion or less, then why pay any more for Uber?
The bottom line: it is hard to justify paying anything more than $17 billion for Uber, which represents a 69% downside to the current market cap.
Catalyst: Market Can Remain Irrational, But These Events Could Send Shares Lower
While Uber enjoys a reprieve in its legal battles in California, it is likely short-lived. The court simply extended the deadline for Uber to comply with AB-5 and required it to agree to multiple conditions in order for the stay to remain in place during the firm’s appeal. Should Uber fail to meet these conditions and the stay expires, shares could drop.
Additionally, the above lawsuit is not the only one pressuring Uber’s business. San Francisco filed a lawsuit against DoorDash, which relies on a similar argument used against Uber and Lyft’s ride haling businesses under AB-5. Should San Francisco prevail, it could have negative implications for Uber Eats in San Francisco.
Lastly, Uber and Lyft are pouring millions into convincing voters in California to pass Proposition 22, which would exempt the firms from AB-5. Should Prop 22 fail in November, it would permanently alter Uber’s business in California, and make it much easier to other states to impose similar laws.
Apart from legal issues, any earnings disappointment could send shares lower, as the firm’s path to profitably remains in question.
What Noise Traders Miss With UBER
These days, fewer investors pay attention to fundamentals and the red flags buried in financial filings. Instead, due to the proliferation of noise traders, the focus tends toward technical trading tends while high-quality fundamental research is overlooked. Here’s a quick summary for noise traders when analyzing UBER:
- Core and economic earnings remain highly negative
- Market share is declining in rideshare and stagnant (excluding acquisitions) in food delivery
- Valuation implies Uber will own over 100% of the rideshare and food delivery TAM by 2025
Executive Compensation Adds Additional Risk
Unfortunately for investors, Uber’s executive compensation plan further enables value destruction and provides little accountability to actual profits. Executives are eligible for annual cash bonuses and equity incentives that consist of performance- and time-based restricted stock units.
The annual cash bonuses are measured against (1) key financial metrics, such as gross bookings, adjusted net revenue, and adjusted EBITDA, (2) strategic priorities, which include “executing constructive M&A opportunities” and moving Uber’s big bets, and (3) company-wide objectives such as increasing monthly active customers, improving safety and transparency, global expansion, and adjusted EBITDA.
Performance RSUs are earned over a 3-year performance period. In 2019, performance RSUs were tied to gross bookings, core platform contribution, adjusted EBITDA, and diversity & inclusion.
Uber’s compensation plan reminds us of the misaligned incentives that led to the blowup of Valeant (VRX). Like Valeant’s plan, Uber’s compensation plan uses adjusted, “Non-GAAP” measures and focuses on top-line growth and M&A goals that incentivize excessive risk-taking with no accountability to the true fundamentals of the business.
Without significant changes to its executive compensation, Uber is incentivized to boost top-line growth numbers with no attention to prudent capital stewardship. We’d recommend the firm’s compensation committee tie pay to improving ROIC, which is directly correlated with creating shareholder value.
Insider Trading and Short Interest
Over the past three months, insiders have purchased 16 thousand shares and sold 457 thousand shares sold for a net effect of 442 thousand shares sold. These sales represent less than 1% of shares outstanding.
There are currently 49.6 million shares sold short, which equates to 3% of shares outstanding and two days to cover. The number of shares sold short has declined by 9% since last month.
Critical Details Found in Financial Filings by Our Robo-Analyst Technology
As investors focus more on fundamental research, research automation technology is needed to analyze all the critical financial details in financial filings as shown in the Harvard Business School and MIT Sloan paper, "Core Earnings: New Data and Evidence”.
Below are specifics on the adjustments we make based on Robo-Analyst findings in Uber’s 10-Q and 10-K:
Income Statement: we made $3.3 billion of adjustments, with a net effect of removing $1.8 billion in non-operating expenses (3% of revenue). You can see all the adjustments made to Uber’s income statement here.
Balance Sheet: we made $7.2 billion of adjustments to calculate invested capital with a net decrease of $1.9 billion. One of the most notable adjustments was $2 billion in deferred tax assets. This adjustment represented 8% of reported net assets. You can see all the adjustments made to Uber’s balance sheet here.
Valuation: we made $11.8 billion of adjustments with a net effect of decreasing shareholder value by $11.8 billion. There were no adjustments that increased shareholder value. Apart from total debt, the most notable adjustment to shareholder value was $971 million in minority interests. This adjustment represents 2% of Uber’s market cap. See all adjustments to Uber’s valuation here.
Unattractive Funds That Hold UBER
The following funds receive our Unattractive-or-worse rating and allocate significantly to Uber.
- Morgan Stanley Growth Portfolio (MSEQX) – 4.8% allocation and Very Unattractive rating
- Morgan Stanley Insight Fight (MCRTX) – 4.8% allocation and Very Unattractive rating
- Morgan Stanley Global Opportunity Portfolio (MGGPX) – 4.8% allocation and Unattractive rating
- Transamerica Capital Growth (TCPWX) – 4.5% allocation and Very Unattractive rating
- Professionally Managed Hodges Fund (HDPMX) – 4.5% allocation and Unattractive rating
- First Trust U.S. Equity Opportunities ETF (FPX) – 3.7% allocation and Unattractive rating
- Cavanal Hill World Energy Fund (AAWEX) – 3.0% allocation and Unattractive rating
This article originally published on August 24, 2020.
Disclosure: David Trainer, Kyle Guske II, and Matt Shuler receive no compensation to write about any specific stock, sector, style, or theme.
Follow us on Twitter, Facebook, LinkedIn, and StockTwits for real-time alerts on all our research.
[1] Our core earnings are a superior measure of profits, as demonstrated in Core Earnings: New Data & Evidence a paper by professors at Harvard Business School (HBS) & MIT Sloan. The paper empirically shows that our data is superior to “Operating Income After Depreciation” and “Income Before Special Items” from Compustat, owned by S&P Global (SPGI).