
Recap from November’s Picks
Our Most Attractive Stocks (+3.5%) outperformed the S&P 500 (+2.3%) last month. Most Attractive Large Cap stock The Gap, Inc. (GPS) gained 29%. Most Attractive Small Cap stock Childrens Place (PLCE) was up 25%. Overall, 23 out of the 40 Most Attractive stocks outperformed the S&P 500 in November, and 28 had positive returns.
Our Most Dangerous Stocks (+1.3%) outperformed the S&P 500 (+2.3%) as a short portfolio last month. Most Dangerous Large Cap stock Equinix Inc. (EQIX) fell by 10% and Most Dangerous Small Cap Stock ScanSource Inc. (SCSC) fell by 17%. Overall, 22 out of the 40 Most Dangerous stocks outperformed the S&P 500 as shorts in November.
The successes of the Most Attractive and Most Dangerous stocks highlight the value of our Robo-Analyst technology, which helps clients fulfill the fiduciary duty of care when making investment recommendations[1].
22 new stocks make our Most Attractive list this month and 21 new stocks fall onto the Most Dangerous list this month. December’s Most Attractive and Most Dangerous stocks were made available to members on December 6, 2017.
Our Most Attractive stocks have high and rising returns on invested capital (ROIC) and low price to economic book value ratios. Most Dangerous stocks have misleading earnings and long growth appreciation periods implied by their market valuations.
Most Attractive Stocks Feature for December: Lam Research Corp (LRCX: $186/share)
Lam Research Corp (LRCX), a semiconductor equipment firm, is the featured stock from December’s Most Attractive Stocks Model Portfolio. LRCX was featured in our special report “Selling Shovels in a Gold Rush” and is up 20%, while the S&P 500 is up 9%, since the report was published. Even after outperforming the market, LRCX still presents significant upside potential.
LRCX’s revenue has grown by 12% compounded annually over the past decade and its after-tax profit (NOPAT) has grown 11% compounded annually over the same time. LRCX’s NOPAT margin has increased from 9% in 2012 to 24% over the last twelve months (TTM). The company has also improved its return on invested capital (ROIC) from 14% in 2012 to a top-quintile 46% TTM.
Figure 1: LRCX’s Revenue and Profit Growth Since 2007
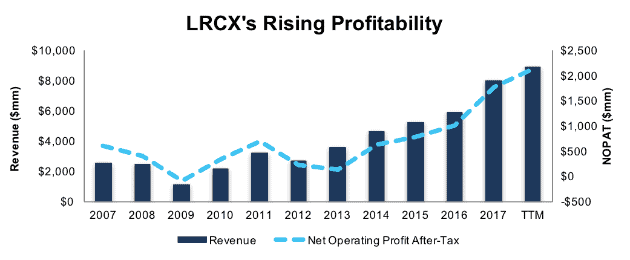
Sources: New Constructs, LLC and company filings
LRCX Priced for No Profit Growth
At its current price of $186/share, LRCX has a price-to-economic book value (PEBV) ratio of 1.0. This ratio means the market expects LRCX’s NOPAT to never meaningfully grow from current levels. This expectation seems overly pessimistic for a firm that has grown NOPAT by 11% compounded annually over the past decade.
If LRCX can maintain 2017 NOPAT margins of 22% (below TTM margins of 24%) and grow NOPAT by just 6% compounded annually for the next decade, the stock is worth $252/share – a 35% upside.
Auditable Impact of Footnotes and Forensic Accounting Adjustments
Our Robo-Analyst technology enables us to perform forensic accounting with scale and provide the research needed to fulfill fiduciary duties. In order to derive the true recurring cash flows, an accurate invested capital, and an accurate shareholder value, we made the following adjustments to Lam Research’s 2017 10-K:
Income Statement: we made $270 million of adjustments, with a net effect of removing $78 million in non-operating expense (1% of revenue). We removed $96 million in non-operating income and $174 million in non-operating expenses. You can see all the adjustments made to LRCX’s income statement here.
Balance Sheet: we made $7.7 billion of adjustments to calculate invested capital with a net decrease of $4.4 billion. One of the most notable adjustments was $371 million due to asset write-downs. This adjustment represented 4% of reported net assets. You can see all the adjustments made to LRCX’s balance sheet here.
Valuation: we made $8.7 billion of adjustments with a net effect of increasing shareholder value by $3.4 billion. The largest adjustment to shareholder value was $6 billion in excess cash. This adjustment represents 20% of LRCX’s market cap.
Most Dangerous Stocks Feature: GP Strategies (GPX: $23/share)
GP Strategies (GPX), professional and technical services training provider, is the featured stock from December’s Most Dangerous Stocks Model Portfolio.
Since 2012, GP Strategies’ revenue has increased 5% compounded annually while economic earnings have fallen from $7 million to -$5 million TTM. The firm’s NOPAT margin has declined from 6% in 2012 to 4% TTM and its ROIC fell from 9% to 5% over the same time.
Figure 2: GPX’s Falling Economic Earnings
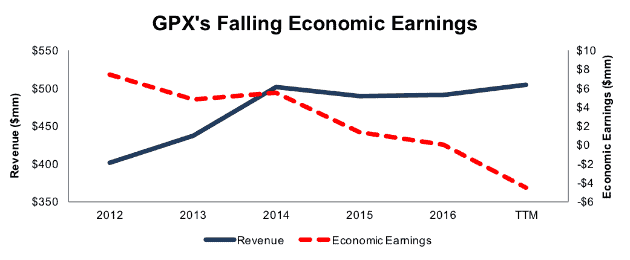
Sources: New Constructs, LLC and company filings
GPX Provides Poor Risk/Reward Tradeoff
GPX is down 21% year-to-date while the S&P is up nearly 18%. Even after the large underperformance, GPX is still overvalued and shares present significant downside risk.
To justify its current price of $23/share, GPX must maintain TTM margins (4%) and grow NOPAT by 9% compounded annually for the next 13 years. This expectation seems overly optimistic given GPX’s continued shareholder value destruction and margin declines in four consecutive years.
Even if GPX can reverse years of margin decline, maintain TTM margins, and grow NOPAT by 4% compounded annually for the next decade, the stock is worth just $16/share today – a 30% downside.
Auditable Impact of Footnotes and Forensic Accounting Adjustments
Our Robo-Analyst technology enables us to perform forensic accounting with scale and provide the research needed to fulfill fiduciary duties. In order to derive the true recurring cash flows, an accurate invested capital, and an accurate shareholder value, we made the following adjustments to GPX Strategies’ 2016 10-K:
Income Statement: we made $5 million of adjustments, with a net effect of removing $1 million in non-operating expense (<1% of revenue). We removed $2 million in non-operating income and $3 million in non-operating expenses. You can see all the adjustments made to GPX’s income statement here.
Balance Sheet: we made $182 million of adjustments to calculate invested capital with a net increase of $162 million. One of the largest adjustments was $57 million due to asset write-downs. This adjustment represented 28% of reported net assets. You can see all the adjustments made to GPX’s balance sheet here.
Valuation: we made $88 million of adjustments with a net effect of decreasing shareholder value by $88 million. There were no adjustments that increased shareholder value. The largest adjustment to shareholder value was $29 million in off-balance sheet operating leases. This adjustment represents 8% of GPX’s market cap.
This article originally published on December 11, 2017.
Disclosure: David Trainer, Kyle Guske II, and Sam McBride receive no compensation to write about any specific stock, style, or theme.
Follow us on Twitter, Facebook, LinkedIn, and StockTwits for real-time alerts on all our research.
[1] Ernst & Young’s recent white paper “Getting ROIC Right” proves the superiority of our holdings research and analytics.
Click here to download a PDF of this report.
Photo Credit: Alberto Carrasco-Casado (Flickr)