
Sixteen new stocks made our Most Attractive list this month, while fifteen new stocks joined the Most Dangerous list. We published June’s Most Attractive and Most Dangerous stocks to members on June 2, 2023.
May Performance Recap
Our Most Attractive Stocks (-0.1%) underperformed the S&P 500 (+2.2%) last month by 2.3%. The best performing large cap stock gained 13% and the best performing small cap stock was up 47%. Overall, 14 out of the 40 Most Attractive stocks outperformed the S&P 500.
Our Most Dangerous Stocks (-4.0%) outperformed the S&P 500 (+2.2%) as a short portfolio last month by 6.2%. The best performing large cap short stock fell by 17% and the best performing small cap short stock fell by 32%. Overall, 21 out of the 28 Most Dangerous stocks outperformed the S&P 500 as shorts.
The Most Attractive/Most Dangerous Model Portfolios outperformed as an equal-weighted long/short portfolio by 3.9%.
This report leverages our cutting-edge Robo-Analyst technology to deliver proven-superior[1] fundamental research and support more cost-effective fulfillment of the fiduciary duty of care.
All of our Most Attractive stocks have high (and rising) return on invested capital (ROIC) and low price to economic book value ratio. Most Dangerous stocks have misleading earnings and long growth appreciation periods implied by their market valuations.
Most Attractive Stocks Feature for June: Zions Bancorporation (ZION: $31/share)
Zions Bancorporation is the featured stock from June’s Most Attractive Stocks Model Portfolio.
Zions has grown revenue by 6% compounded annually and net operating profit after tax (NOPAT) by 21% compounded annually since 2012. Zions’ NOPAT margin increased from 10% in 2012 to 38% in the trailing twelve months (TTM), and invested capital turns rose from 0.3 to 0.4 over the same time. Rising NOPAT margins and invested capital turns drive Zions’ return on invested capital (ROIC) from 2% in 2012 to 15% in the TTM.
Figure 1: Zions Revenue and NOPAT Since 2012
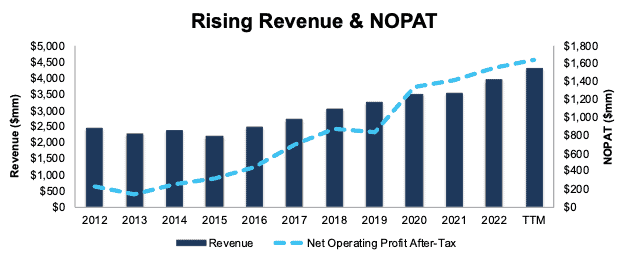
Sources: New Constructs, LLC and company filings
Zions Is Undervalued
At its current price of $31/share, ZION has a price-to-economic book value (PEBV) ratio of 0.3. This ratio means the market expects Zions’ NOPAT to permanently decline by 70%. This expectation seems overly pessimistic for a company that has grown NOPAT by 18% compounded annually since 2017 and 21% compounded annually since 2012.
Even if Zions’ NOPAT margin falls to 20% (compared to 38% in the TTM) and the company’s revenue grows just 1% compounded annually through 2032, the stock would be worth $60/share today – an 87% upside. In this scenario, Zions’s NOPAT would decline 6% compounded annually through 2032. Should Zions grow profits more in line with historical levels, the stock has even more upside.
Critical Details Found in Financial Filings by Our Robo-Analyst Technology
Below are specifics on the adjustments we made based on Robo-Analyst findings in Zions Industries’ 10-Qs and 10-Ks:
Income Statement: we made $117 million in adjustments, with a net effect of removing $94 million in non-operating expenses (2% of revenue). Clients can see all adjustments made to Zions’ income statement on the GAAP Reconciliation tab on the Ratings page on our website.
Balance Sheet: we made $6.9 billion in adjustments to calculate invested capital with a net increase of $4.0 billion. One of the most notable adjustments was $3.1 billion in adjustments for other comprehensive income. This adjustment represents 46% of reported net assets. Clients can see all adjustments made to Zions’s balance sheet on the GAAP Reconciliation tab on the Ratings page on our website.
Valuation: we made $670 million in adjustments, all of which decreased shareholder value. The most notable adjustment was $440 million in net value of preferred capital. This adjustment represents 9% of Zions’ market value. Clients can see all adjustments to Zions’ valuation on the GAAP Reconciliation tab on the Ratings page on our website.
Most Dangerous Stocks Feature: MGM Resorts International (MGM: $42/share)
MGM Resorts (MGM) is the featured stock from June’s Most Dangerous Stocks Model Portfolio.
Though MGM Resorts revenue grew 5% compounded annually from 2017 to the TTM, the company’s NOPAT margin fell from 14% to -4% and invested capital turns remained unchanged at 0.3 over the same time. Falling NOPAT margins drive MGM’s ROIC from 5% in 2017 to -1% over the TTM. MGM’s economic earnings, the true cash flows of the business, have fallen from $-830 million 2017 to -$3.9 billion in the TTM. See Figure 2.
Figure 2: MGM Economic Earnings Since 2016
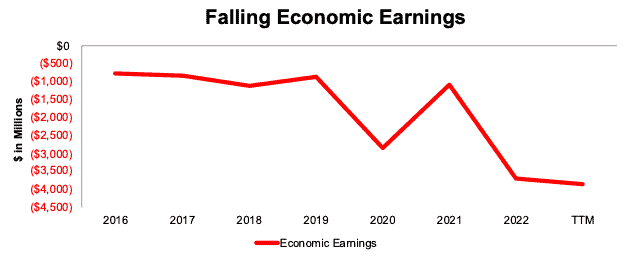
Sources: New Constructs, LLC and company filings
MGM Provides Poor Risk/Reward
Despite its poor fundamentals, MGM’s stock is priced for significant profit growth, and we believe the stock is overvalued.
To justify its current price of $42/share, MGM must improve its NOPAT margin to 10% (5x its five-year average) and grow revenue by 11% compounded annually for the next decade (compared to 4% compounded annually over the past decade). In this scenario, MGM’s NOPAT in 2032 would equal $3.6 billion, or more than 2x its highest-ever NOPAT, achieved in 2019. We think these expectations are overly optimistic.
Even if MGM improves its NOPAT margin to 8% and grows revenue and 9% compounded annually for the next decade, the stock would be worth no more than $7/share today – an 83% downside to the current stock price.
Each of these scenarios also assumes MGM can grow revenue, NOPAT, and FCF without increasing working capital or fixed assets. This assumption is unlikely but allows us to create best case scenarios that demonstrate the high expectations embedded in the current valuation.
Critical Details Found in Financial Filings by Our Robo-Analyst Technology
Below are specifics on the adjustments we made based on Robo-Analyst findings in MGM’s 10-Qs and 10-Ks:
Income Statement: we made $7.3 billion in adjustments, with a net effect of removing $2.1 billion in non-operating income (15% of revenue). Clients can see all adjustments made to MGM’s income statement on the GAAP Reconciliation tab on the Ratings page on our website.
Balance Sheet: we made $25.8 billion in adjustments to calculate invested capital with a net increase of $858 million. One of the most notable adjustments was $6.3 billion in asset write-downs. This adjustment represented 15% of reported net assets. Clients can see all adjustments made to MGM’s balance sheet on the GAAP Reconciliation tab on the Ratings page on our website.
Valuation: we made $35.6 billion in adjustments, with a net decrease to shareholder value of $27.1 billion. The most notable adjustment to shareholder value was $4.0 billion in operating leases. This adjustment represents 26% of MGM’s market value. Clients can see all adjustments to MGM’s valuation on the GAAP Reconciliation tab on the Ratings page on our website.
This article was originally published on June 9, 2023.
Disclosure: David Trainer, Kyle Guske II, and Italo Mendonça receive no compensation to write about any specific stock, style, or theme.
Questions on this report or others? Join our Society of Intelligent Investors and connect with us directly.
[1] Our research utilizes our Core Earnings, a more reliable measure of profits, as proven in Core Earnings: New Data & Evidence, written by professors at Harvard Business School (HBS) & MIT Sloan and published in The Journal of Financial Economics.