
Recap from April’s Picks
Our Most Attractive Stocks (-0.4%) underperformed the S&P 500 (+0.4%) last month. Most Attractive Large Cap stock USANA Health Sciences (USNA) gained 15%. Most Attractive Small Cap stock Heidrick & Struggles International (HSII) was up 21%. Overall, 16 out of the 40 Most Attractive stocks outperformed the S&P 500 in April.
Our Most Dangerous Stocks (-0.6%) outperformed the S&P 500 (+0.4%) as a short portfolio last month. Most Dangerous Large Cap stock Dish Network Corp (DISH) fell by 14% and Most Dangerous Small Cap Stock Unifi Inc. (UFI) fell by 17%. Overall, 22 out of the 40 Most Dangerous stocks outperformed the S&P 500 as shorts in April.
The successes of these model portfolios highlight the value of our machine learning and AI Robo-Analyst technology[1], which helps clients fulfill the fiduciary duty of care and make smarter investments[2].
13 new stocks make our Most Attractive list this month and 14 new stocks fall onto the Most Dangerous list this month. May’s Most Attractive and Most Dangerous stocks were made available to members on May 3, 2018.
Our Most Attractive stocks have high and rising returns on invested capital (ROIC) and low price to economic book value ratios. Most Dangerous stocks have misleading earnings and long growth appreciation periods implied by their market valuations.
Most Attractive Stocks Feature for May: Winnebago Industries (WGO: $35/share)
Winnebago Industries (WGO), recreational vehicle manufacturer, is the featured stock from May’s Most Attractive Stocks Model Portfolio.
Over the past decade, WGO has grown revenue 6% compounded annually while after-tax operating profit (NOPAT) has grown 7% compounded annually, to $74 million in 2017. NOPAT has increased to $100 million over the last twelve months (TTM). The company’s NOPAT margin has increased from 4% in 2013 to 5% TTM.
Figure 1: WGO’s Revenue & NOPAT Since 2009
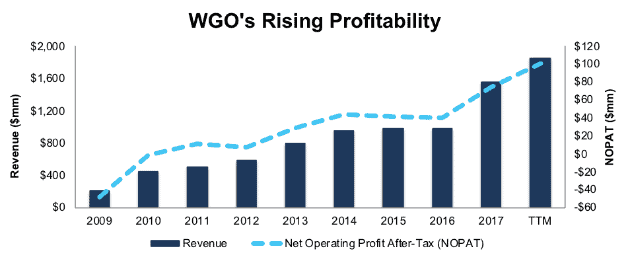
Sources: New Constructs, LLC and company filings
WGO Valuation Provides Upside
WGO has outperformed over the past five years (up 78% vs. 61% for the S&P 500) but is down 26% over the past six months. This recent price decline has left WGO significantly undervalued. At its current price of $35/share, WGO has a price-to-economic book value (PEBV) ratio of 1.0. This ratio means the market expects WGO’s NOPAT to never meaningfully grow from its current levels. This expectation seems rather pessimistic for a company that has grown NOPAT by 7% compounded annually since 1998.
If WGO can maintain 2017 NOPAT margins (5%) and grow NOPAT by 7% compounded annually for the next decade, the stock is worth $46/share today – a 31% upside. See the math behind this dynamic DCF scenario here.
Critical Details Found in Financial Filings By Our Robo-Analyst Technology
As investors focus more on fundamental research, research automation technology is needed to analyze all the critical financial details in financial filings. Below are specifics on the adjustments we make based on Robo-Analyst findings in Winnebago Industries’ 2017 10-K:
Income Statement: we made $85 million of adjustments, with a net effect of removing $3 million in non-operating expense (<1% of revenue). We removed $41 million in non-operating income and $44 million in non-operating expenses. You can see all the adjustments made to WGO’s income statement here.
Balance Sheet: we made $187 million of adjustments to calculate invested capital with a net decrease of $64 million. One of the largest adjustments was $105 million due to midyear acquisitions. This adjustment represented 14% of reported net assets. You can see all the adjustments made to WGO’s balance sheet here.
Valuation: we made $306 million of adjustments with a net effect of decreasing shareholder value by $306 million. There were no adjustments that increased shareholder value. The largest adjustment to shareholder value was $287 million in total debt, which includes $15 million in off-balance sheet operating leases. This lease adjustment represents 1% of WGO’s market cap.
Most Dangerous Stocks Feature: Knowles Corp (KN: $14/share)
Knowles Corp (KN), manufacturer of audio components for mobile devices, is the featured stock from May’s Most Dangerous Stocks Model Portfolio. Knowles was featured as a Danger Zone pick in January 2018. Since then, KN is down 14% while the S&P is down 6%. KN remains significantly overvalued even after this price decline.
Since 2012, KN’s revenue has fallen 8% compounded annually while its NOPAT fell 21% compounded annually, to $44 million in 2017. NOPAT has fallen further, to $33 million, over the last twelve months. KN’s NOPAT margin fell from 13% in 2012 to 5% TTM while its ROIC declined from 8% to 2% over the same time.
Figure 2: KN’s NOPAT Since 2012
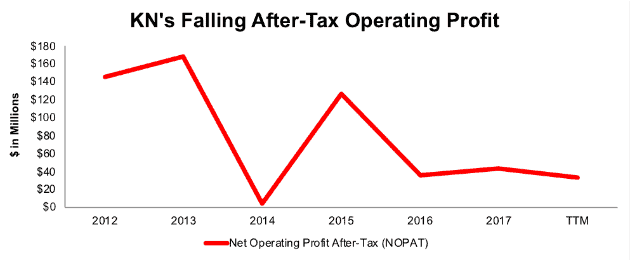
Sources: New Constructs, LLC and company filings
KN Provides Poor Risk/Reward Tradeoff
KN is down 25% (S&P up 12%) over the past year, as the market has begun to catch on to its deteriorating fundamentals. However, shares remain significantly overvalued.
To justify its current price of $14/share, KN must maintain TTM margins (5%) and grow NOPAT by 11% compounded annually for the next 13 years. This expectation seems rather optimistic considering KN’s NOPAT has fallen 21% compounded annually since 2012. See the math behind this dynamic DCF scenario here.
Even if we assume KN can maintain 5% NOPAT margins and grow NOPAT by 5% compounded annually for the next decade, the stock is worth just $6/share today – a 57% downside. See the math behind this dynamic DCF scenario here.
Critical Details Found in Financial Filings By Our Robo-Analyst Technology
As investors focus more on fundamental research, research automation technology is needed to analyze all the critical financial details in financial filings. Below are specifics on the adjustments we make based on Robo-Analyst findings in Knowles Corp’s 2017 10-K:
Income Statement: we made $150 million of adjustments, with a net effect of removing $25 million in non-operating income (3% of revenue). We removed $87 million in non-operating income and $63 million in non-operating expenses. You can see all the adjustments made to KN’s income statement here.
Balance Sheet: we made $738 million of adjustments to calculate invested capital with a net increase of $540 million. One of the largest adjustments was $427 million due to asset write-downs. This adjustment represented 31% of reported net assets. You can see all the adjustments made to KN’s balance sheet here.
Valuation: we made $290 million of adjustments with a net effect of decreasing shareholder value by $238 million. The largest adjustment to shareholder value was $243 million in total debt, which includes $49 million in off-balance sheet operating leases. This lease adjustment represents 4% of KN’s market cap.
This article originally published on May 10, 2018.
Disclosure: David Trainer and Kyle Guske II receive no compensation to write about any specific stock, style, or theme.
Follow us on Twitter, Facebook, LinkedIn, and StockTwits for real-time alerts on all our research.
[1] Harvard Business School features the powerful impact of our research automation technology in the case New Constructs: Disrupting Fundamental Analysis with Robo-Analysts.
[2] Ernst & Young’s recent white paper “Getting ROIC Right” proves the superiority of our holdings research and analytics.
Click here to download a PDF of this report.
Photo Credit: GotCredit (Flickr)