
Nine new stocks make our Safest Dividend Yield Model Portfolio this month, which was made available to members on May 23, 2018.
Recap from April’s Picks
Our Safest Dividend Yields Model Portfolio outperformed the S&P 500 last month. The Model Portfolio rose 6.3% on a price return basis and rose 6.5% on a total return basis. The S&P 500 rose 2.5% on a price return and total return basis. The best performing stocks in the portfolio were large cap stock Chimera Investment Corp (CIM), which was up 6%, and small cap stock, DSW Inc. (DSW), which was up 22%. Overall, 12 out of the 20 Safest Dividend Yield stocks outperformed the S&P in April.
This Model Portfolio leverages our Robo-Analyst technology[1], which scales our forensic accounting expertise (featured in Barron’s) across thousands of stocks.[2]
This Model Portfolio only includes stocks that earn an Attractive or Very Attractive rating, have positive free cash flow and economic earnings, and offer a dividend yield greater than 3%. Companies with strong free cash flow provide higher quality and safer dividend yields because we know they have the cash to support the dividend. We think this portfolio provides a uniquely well-screened group of stocks that can help clients outperform.
Featured Stock for May: Federated Investors (FII: $24/share)
Federated Investors (FII), an asset management holding company, is the featured stock in May’s Safest Dividend Yields Model Portfolio.
Since 2014, FII has grown revenue and after-tax operating profit (NOPAT) by 3% compounded annually, per Figure 1. NOPAT margins have averaged 20% since 2012 and currently sit at 21% over the last twelve months (TTM). The company has earned a double-digit return on invested capital (ROIC) in every year of our model (which dates to 1998) and currently earns a top-quintile 18% ROIC.
Figure 1: FII Revenue & NOPAT Since 2014
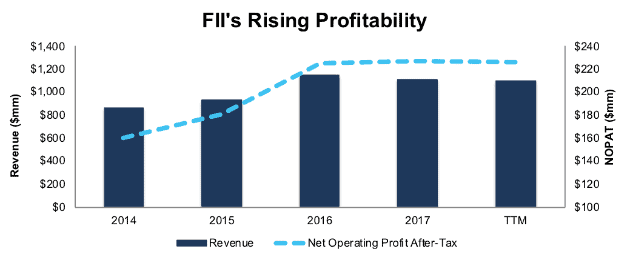
Sources: New Constructs, LLC and company filings
Free Cash Flow Supports Dividend Payments
Over the past five years, FII has paid annual regular dividends of $1/share. In 2016, the company also paid an additional $1/share special dividend. The consistent dividend payment has been supported by FII’s strong free cash flow. Since 2013, FII has generated a cumulative $769 million (31% of market cap) in FCF while paying $619 million in dividends.
Companies with strong free cash flow provide higher quality dividend yields because we know the firm has the cash to support its dividend. On the flip side, dividends from companies with low or negative free cash flow cannot be trusted as much because the company may not be able to sustain paying dividends.
Figure 2: FII’s FCF vs. Dividends Since 2013
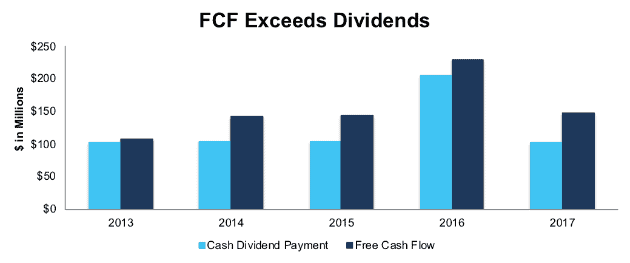
Sources: New Constructs, LLC and company filings
FII Remains Undervalued
At its current price of $24/share, FII has a price-to-economic book value (PEBV) ratio of 1.0. This ratio means the market expects FII’s NOPAT to never meaningfully grow over the remaining life of the firm. This expectation seems pessimistic given that FII has grown NOPAT by 3% compounded annually since 1998.
If FII can maintain TTM NOPAT margins (21%) and continue to grow NOPAT by just 3% compounded annually over the next decade, the stock is worth $32/share today – a 33% upside. See the math behind this dynamic DCF scenario here.
Critical Details Found in Financial Filings By Our Robo-Analyst Technology
As investors focus more on fundamental research, research automation technology is needed to analyze all the critical financial details in financial filings. Below are specifics on the adjustments we make based on Robo-Analyst findings in Federated Investors’ 2017 10-K:
Income Statement: we made $104 million of adjustments with a net effect of removing $53 million in non-operating income (5% of revenue). We removed $26 million related to non-operating expenses and $78 million related to non-operating income. See all adjustments made to FII’s income statement here.
Balance Sheet: we made $207 million of adjustments to calculate invested capital with a net increase of $127 million. The most notable adjustment was $113 million (10% of reported net assets) related to operating leases. See all adjustments to FII’s balance sheet here.
Valuation: we made $429 million of adjustments with a net effect of decreasing shareholder value by $429 million. There were no adjustments that increased shareholder value. Apart from $278 million in total debt, which includes the operating leases noted above, the largest adjustment to shareholder value was $122 million in net deferred tax liabilities. This adjustment represents 5% of FII’s market value. Despite decreasing shareholder value, FII remains undervalued.
This article originally published on May 30, 2018.
Disclosure: David Trainer, Kyle Guske II, and Sam McBride receive no compensation to write about any specific stock, style, or theme.
Follow us on Twitter, Facebook, LinkedIn, and StockTwits for real-time alerts on all our research.
[1] Harvard Business School features the powerful impact of our research automation technology in the case New Constructs: Disrupting Fundamental Analysis with Robo-Analysts.
[2] Ernst & Young’s recent white paper “Getting ROIC Right” proves the superiority of our holdings research and analytics.
Click here to download a PDF of this report.
Photo Credit: moritz320 (Flickr)