Three new stocks make our Safest Dividend Yield Model Portfolio this month, which was made available to members on October 20, 2017.
Recap from September’s Picks
Our Safest Dividend Yield Model Portfolio outperformed the S&P 500 last month on total return basis and underperformed on a price return basis. The Model Portfolio rose 2.4% on a price return basis and 3.2% on a total return basis. The S&P 500 rose 2.5% on a price and total return basis. The best performing stocks in the portfolio were large cap stock General Motors (GM), which was up 15%, and small cap stock, Waddell & Reed Financial (WDR), which was up 9%. Overall, seven out of the 20 Safest Dividend Yield stocks outperformed the S&P in October and 12 had positive returns.
Since inception, this Model Portfolio is up 12% on a price return basis (S&P +18%) and 18% on a total return basis (S&P +21%).
This Model Portfolio leverages our Robo-Analyst technology, which scales our forensic accounting expertise (featured in Barron’s) across thousands of stocks[1].
This Model Portfolio only includes stocks that earn an Attractive or Very Attractive rating, have positive free cash flow and economic earnings, and offer a dividend yield greater than 3%. Companies with strong free cash flow provide higher quality and safer dividend yields because we know they have the cash to support the dividend. We think this portfolio provides a uniquely well-screened group of stocks that can help clients outperform.
Featured Stock for October: Cisco Systems (CSCO: $35/share)
Cisco Systems (CSCO) is the featured stock in October’s Safest Dividend Yield Model Portfolio. We first featured CSCO as a Long Idea in December 2014. Since then, the stock is up 26% while the S&P is up 25%.
Over the past decade, CSCO has grown revenue by 3% compounded annually while growing after-tax profit (NOPAT) by 4% compounded annually. Over this time, CSCO’s NOPAT margin has improved from 19% in 2007 to 21% in 2017.
Figure 1: CSCO NOPAT Growth Over the Past Decade
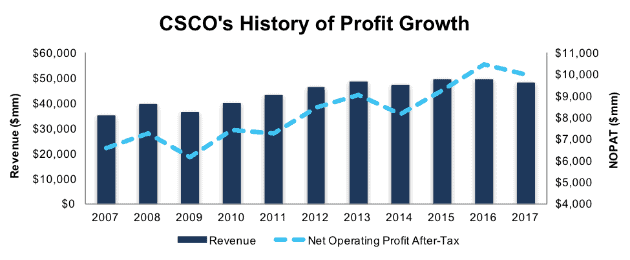
Sources: New Constructs, LLC and company filings
Free Cash Flow Supports Dividend Growth
CSCO has increased its quarterly dividend from $0.14 to $0.29 over the past five years, or 16% compounded annually. Dividend growth has been made possible by CSCO’s strong free cash flow. Per Figure 2, CSCO has generated cumulative FCF of $31 billion (18% of market cap) and paid out cumulative dividends of $21 billion since 2013.
Companies with strong free cash flow provide higher quality dividend yields because we know the firm has the cash to support its dividend. On the flip side, dividends from companies with low or negative free cash flow cannot be trusted as much because the company may not be able to sustain paying dividends.
Figure 2: CSCO’s FCF vs Dividends Since 2013
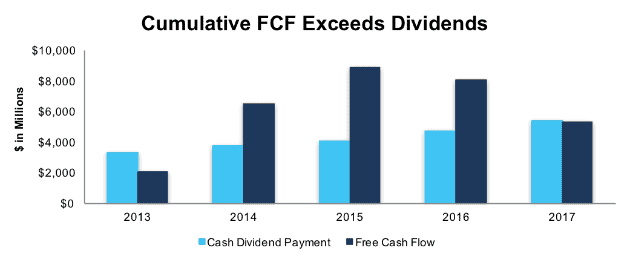
Sources: New Constructs, LLC and company filings
CSCO Remains Undervalued
Year-to-date, CSCO has slightly outperformed the market as it is up 14% while the S&P 500 is up 13%. However, the current share price fails to reflect the solid fundamentals and significant cash flow generation. At its current price of $35/share, CSCO has a price-to-economic book value (PEBV) ratio of 0.9. This ratio means the market expects CSCO’s NOPAT to permanently decline by 10%. This expectation seems overly pessimistic for a firm with nearly two-decades of profit growth.
If CSCO can maintain 2017 NOPAT margins (21%) and continue growing NOPAT by just 4% compounded annually for the next decade, the stock is worth $51/share today – a 46% upside. Significant upside potential coupled with CSCO’s 3.4% dividend yield provides investors with an attractive risk/reward opportunity.
Auditable Impact of Footnotes & Forensic Accounting Adjustments
Our Robo-Analyst technology enables us to perform forensic accounting with scale and provide the research needed to fulfill fiduciary duties. In order to derive the true recurring cash flows, an accurate invested capital, and a real shareholder value, we made the following adjustments to Cisco’s 2017 10-K:
Income Statement: we made $3.4 billion of adjustments with a net effect of removing $358 million in non-operating expense (1% of revenue). We removed $1.9 billion related to non-operating expenses and $1.5 billion related to non-operating income. See all adjustments made to CSCO’s income statement here.
Balance Sheet: we made $115 billion of adjustments to calculate invested capital with a net decrease of $40.7 billion. The most notable adjustment was $19.1 billion (19% of reported net assets) related to goodwill. See all adjustments to CSCO’s balance sheet here.
Valuation: we made $108 billion of adjustments with a net effect of increasing shareholder value by $33.3 billion. The largest adjustment to shareholder value $70 billion in excess cash. This adjustment represents 41% of CSCO’s market value.
This article originally published on October 26, 2017.
Disclosure: David Trainer, Kyle Guske II, and Kenneth James receive no compensation to write about any specific stock, style, or theme.
Follow us on Twitter, Facebook, LinkedIn, and StockTwits for real-time alerts on all our research.
[1] Ernst & Young’s recent white paper “Getting ROIC Right” proves the superiority of our holdings research and analytics.
Click here to download a PDF of this report.