
Sector Analysis 4Q16
The Financials sector ranks fifth out of the ten sectors as detailed in our 4Q16 Sector Ratings for ETFs and Mutual Funds report. Last quarter, the Financials sector ranked seventh. It gets our Neutral rating, which is based on an aggregation of ratings of 39 ETFs and 232 mutual funds in the Financials sector as of October 11, 2016. See a recap of our 3Q16 Sector Ratings here.
Figures 1 and 2 show the five best and worst rated ETFs and mutual funds in the sector. Not all Financials sector ETFs and mutual funds are created the same. The number of holdings varies widely (from 24 to 570). This variation creates drastically different investment implications and, therefore, ratings.
Investors seeking exposure to the Financials sector should buy one of the Attractive-or-better rated ETFs or mutual funds from Figures 1 and 2.
Figure 1: ETFs with the Best & Worst Ratings – Top 5

* Best ETFs exclude ETFs with TNAs less than $100 million for inadequate liquidity.
Sources: New Constructs, LLC and company filings
PowerShares KBW Property & Casualty Insurance Portfolio (KBWP), Oppenheimer Financials Sector Revenue ETF (RWW), and State Street SPDR S&P Capital Markets (KCE) are excluded from Figure 1 because their total net assets (TNA) are below $100 million and do not meet our liquidity minimums.
Figure 2: Mutual Funds with the Best & Worst Ratings – Top 5

* Best mutual funds exclude funds with TNAs less than $100 million for inadequate liquidity.
Sources: New Constructs, LLC and company filings
iShares U.S. Financial Services (IYG) is the top-rated Financials ETF and Davis Financial Fund (DVFYX) is the top-rated Financials mutual fund. Both earn a Very Attractive rating.
iShares Real Estate 50 (FTY) is the worst rated Financials ETF and Rydex Real Estate Fund (RYREX) is the worst rated Financials mutual fund. FTY earns a Dangerous rating and RYREX earns a Very Dangerous rating.
582 stocks of the 3000+ we cover are classified as Financials stocks.
American Express (AXP: $64/share) is one of our favorite stocks held by IYG and earns our Very Attractive rating. AXP is on October’s Most Attractive Stocks list and we’ve previously proposed a strategy that could boost its value by $50 billion, which can be read here. Since 2010, American Express has grown after-tax profit (NOPAT) by 25% compounded annually. The company has improved its return on invested capital (ROIC) from 6% in 2010 to 14% over the last twelve months (TTM). Despite the strength in underlying fundamentals, AXP is priced for permanent profit decline. At its current price of $64/share, AXP has a price-to-economic-book value (PEBV) ratio of 0.8. This ratio means the market expects AXP’s NOPAT to permanently decline by 20%. If AXP can grow NOPAT by just 3% compounded annually over the next decade, the stock is worth $94/share today – a 47% upside.
BGC Partners Inc. (BGCP: $9/share) is one of our least favorite stocks held by Financial ETFs and mutual funds and earns a Very Dangerous rating. BGCP is on October’s Most Dangerous Stocks list as well. BGCP’s economic earnings, the true cash flows of the business, have declined from -$26 million in 2005 to -$104 million in 2015. Economic earnings have declined further, to -$105 million TTM. The company’s ROIC has fallen from 13% in 2010 to a bottom-quintile 2% TTM. Despite significant destruction of shareholder value, BGCP remains overvalued. In order to justify its current price of $9/share, BGCP must maintain TTM margins and grow NOPAT by 20% compounded annually for the next 17 years. This expectation seems overly optimistic given the deterioration in BCGP’s fundamentals over the past decade. This scenario also assumes BGCP is able to grow revenue and NOPAT without spending on working capital or fixed assets, which is unlikely, but allows us to create a very optimistic scenario. For reference, BGCP’s invested capital has grown on average $115 million (4% of 2015 revenue) per year over the past decade.
Figures 3 and 4 show the rating landscape of all Financials ETFs and mutual funds.
Figure 3: Separating the Best ETFs From the Worst ETFs
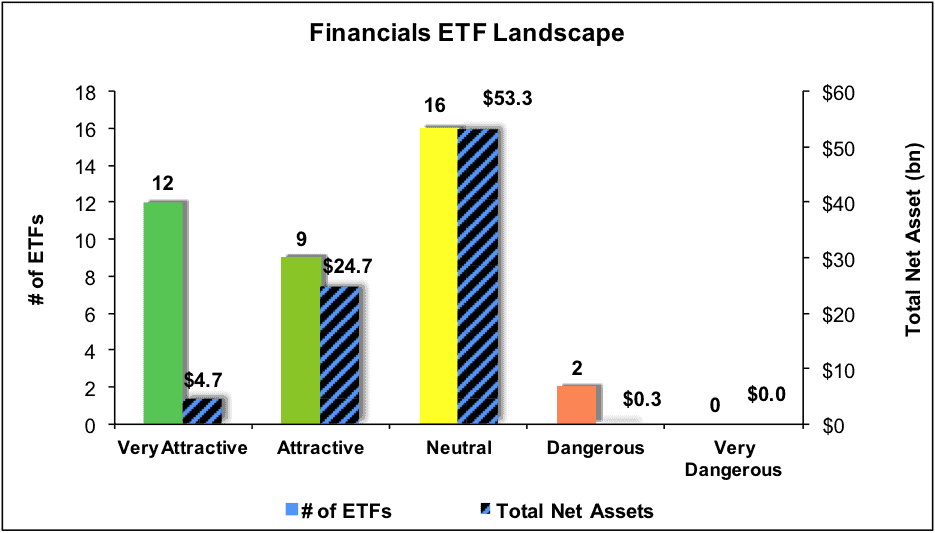
Sources: New Constructs, LLC and company filings
Figure 4: Separating the Best Mutual Funds From the Worst Mutual Funds
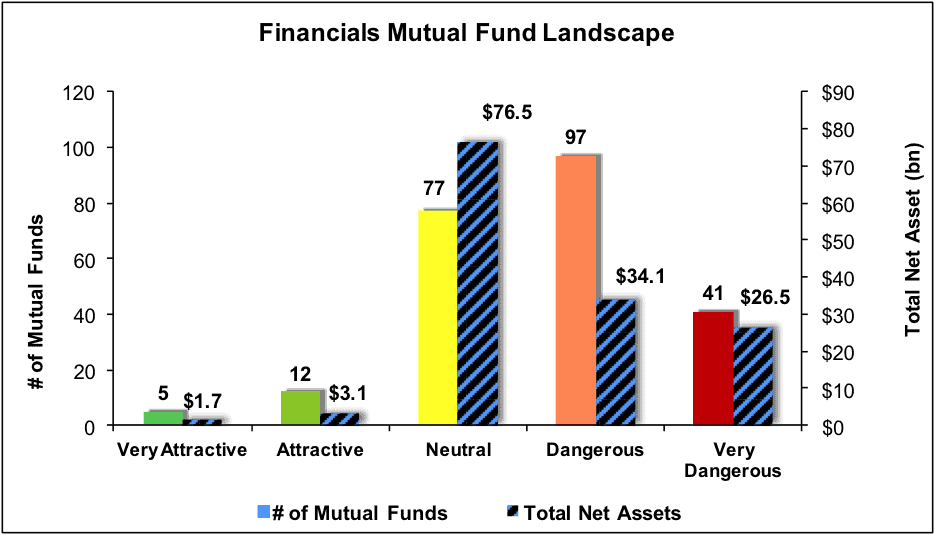
Sources: New Constructs, LLC and company filings
This article originally published here on October 11, 2016.
Disclosure: David Trainer, Kyle Guske II, and Kyle Martone receive no compensation to write about any specific stock, sector or theme.
Click here to download a PDF of this report.
Photo Credit: MA1216 (Flickr)