Our Focus List Stocks: Long Model Portfolio outperformed the S&P 500 by 35% in 2021. This report looks at a Focus List Long stock that outperformed in 2021 and is positioned to outperform again in 2022. Recently we highlighted three underperformers from 2021 that remain undervalued, which you can read here.
HCA Healthcare (HCA: $250/share) outperformed in 2021 and still presents quality risk/reward. We also feature two other Focus List stocks that outperformed in 2021, General Motors (GM) here and AutoZone (AZO) here.Focus List Stocks Outperformed in 2021
The Focus List Stocks: Long Model Portfolio contains the “best of the best” of our Long Ideas, and leverages superior fundamental data[1], which provides a new source of alpha. The current Model Portfolio is available here while real-time updates are available to Pro-and-higher members.
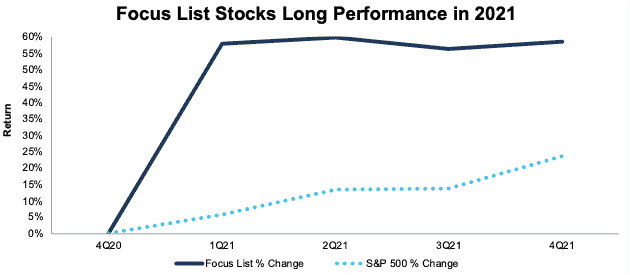
The Focus List Stocks: Long Model Portfolio returned[2],[3], on average, 58% in 2021 compared to 23% for the S&P 500, per Figure 1.
Figure 1: Focus List Stocks: Long Model Portfolio Performance from Period Ending 4Q20 to 4Q21
Sources: New Constructs, LLC
Because our Focus List Stocks: Long Model Portfolio represents the best of the best picks, not all Long Ideas make the Model Portfolio. We published 66 Long Ideas in 2021 but added just six of them to the Focus List Stocks: Long Model Portfolio during the year. Currently, the Focus List Stocks: Long Model Portfolio has 39 stocks.
Figure 2 shows a more detailed breakdown of the Model Portfolio’s performance, which encompasses all the stocks that were in the Model Portfolio at any time in 2021.
Figure 2: Performance of Stocks in the Focus List Stocks: Long Model Portfolio in 2021
Sources: New Constructs, LLC
Performance includes the performance of stocks currently in the Focus List Stocks: Long Model Portfolio, as well as those removed during the year, which is why the number of stocks in Figure 2 (45) is higher than the number of stocks currently in the Model Portfolio (39).
Outperforming Focus List Stock: HCA Healthcare (HCA): Up 56% vs. S&P 500 Up 27% in 2021
We added HCA Healthcare to the Focus List Stocks: Long Model Portfolio in July 2020, and the stock outperformed the S&P 500 by 29% in 2021. We expect HCA Healthcare will continue to outperform the market as the company meets the long-term healthcare demands of an aging population. See our most recent report on HCA Healthcare here.
Main Reason for Outperformance: Recovering Demand for Elective Procedures: Demand for more routine procedures began to recover to pre-pandemic levels in 2021. Outpatient surgeries over the TTM are 13% above 2020 levels and inpatient surgeries are 1% higher over the same time. The partial recovery in surgeries drove the firm’s same-facility revenue higher year-over-year (YoY) in all categories in 3Q21.
Despite pandemic-related challenges and rising labor costs, HCA Healthcare continues to improve its profitability. The company’s NOPAT margin improved from 12% in 2019 before the pandemic to 14% over the TTM. HCA Healthcare’s invested capital turns also improved from 1.4 to 1.5 over the same time. Rising NOPAT margin and improved invested capital turns drive the firm’s ROIC higher from 16% in 2019 to 21% over the TTM.
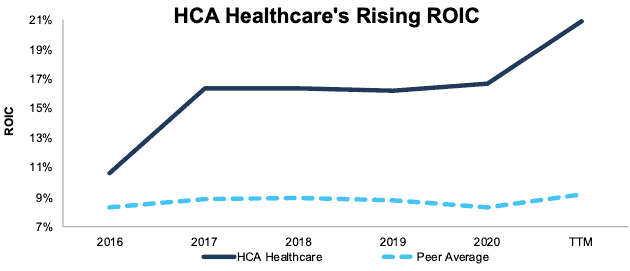
Longer term, HCA Healthcare has improved its ROIC from 11% in 2016 to an industry-leading 21%, which is twice the ROIC of Universal Health Services (UHS), its closest peer, over the TTM. Figure 3 compares HCA Healthcare’s ROIC to its peers’, including Universal Health Services, Encompass Health Corp (EHC), Select Medical Holdings Corp (SEM), and Community Health Systems (CYH).
Figure 3: HCA Healthcare’s ROIC Vs. Peers
Sources: New Constructs, LLC and company filings
Why HCA Healthcare Has Attractive Risk/Reward: Market-Leading Scale Meets Rising Demand: HCA Healthcare is the largest for-profit hospital system in the U.S. and ranks first or second in 27 of 37 of its markets. HCA Healthcare’s strong local market presence combined with the national reach and training capabilities of the firm’s human resources position the firm to keep its facilities staffed in a very tight labor market. The ability to meet rising demand efficiently will be key to the healthcare sector’s profitability in coming years.
HCA Healthcare’s scale also increases the company’s quality of care since the firm can leverage patient data across its network. For example, HCA Healthcare’s vast patient database played an active role in accelerating the pace of developing COVID treatments. The firm is positioned to continue to leverage data-driven solutions to enhance the level of its patient care.
Our original thesis posited that the firm’s volumes would recover to pre-pandemic levels. While demand for surgeries strengthened in 2021, outpatient surgeries over the TTM remain 1% below 2019 levels, and inpatient surgeries are 7% lower over the same time. The U.S. population continues to age, which means demand for healthcare is growing structurally. COVID caused an artificial interruption to the delivery of healthcare services, but there is no sign of a hit to demand. At some point the world will learn to live with COVID and, when it does, HCA Healthcare will have a backlog of procedures in addition to structural demand growth due to an aging population.
HCA Healthcare’s scale also enables the firm to profitably expand its healthcare offerings and adapt to an evolving industry. For example, the company recently diversified its operations beyond traditional hospitals to incorporate outpatient centers and telemedicine. The firm’s strong physical presence, large database, and digital capabilities equip it to serve a variety of patient needs.
Despite Approaching All-Time Highs, HCA Is Still Priced for Permanent Profit Decline: HCA Healthcare’s price-to-economic book value (PEBV) ratio is 0.6. This ratio implies that the market expects HCA Healthcare’s profits will permanently decline by 40%.
Below, we use our reverse discounted cash flow (DCF) model to analyze the expectations for future growth in cash flows baked into a couple of stock price scenarios for HCA Healthcare.
In the first scenario, we assume HCA Healthcare’s:
- NOPAT margin falls to 12% (three-year average vs. 14% TTM) from 2021 through 2030, and
- revenue falls at a <1% CAGR from 2021 to 2030 (vs. consensus CAGR of 7% from 2021 – 2023).
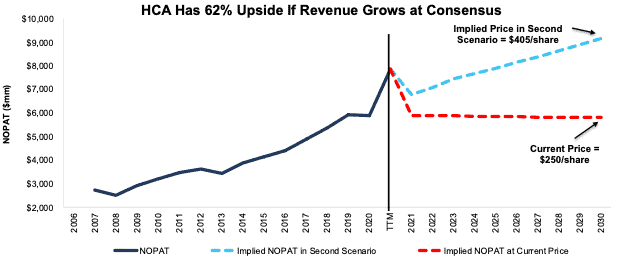
In this scenario, HCA Healthcare’s NOPAT falls by <1% compounded annually over the next decade and the stock is worth $250/share today – equal to the current price. See the math behind this reverse DCF scenario. For reference, HCA Healthcare grew NOPAT by 6% compounded annually from 2010 to 2020.
Shares Could Reach $405 or Higher: If we assume HCA Healthcare’s:
- NOPAT margin falls to 12%, (three-year average vs 14% TTM) from 2021 through 2030, and
- revenue grows at an 8% CAGR from 2021 - 2023 (same as consensus), and
- revenue grows at a 3% CAGR from 2024 - 2030 (below 10-year average CAGR of 5%), then
the stock is worth $405/share today – 62% above the current price. See the math behind this reverse DCF scenario. In this scenario, HCA Healthcare grows NOPAT 5% compounded annually over the next decade.
Should HCA Healthcare grow profits closer to historical levels, the upside in the stock is even greater.
Figure 4: HCA Healthcare’s Historical and Implied NOPAT: DCF Valuation Scenarios
Sources: New Constructs, LLC and company filings
This article originally published on January 12, 2022.
Disclosure: David Trainer, Kyle Guske II, and Matt Shuler receive no compensation to write about any specific stock, sector, style, or theme.
Follow us on Twitter, Facebook, LinkedIn, and StockTwits for real-time alerts on all our research.
[1] Our research utilizes our Core Earnings, a more reliable measure of profits, as proven in Core Earnings: New Data & Evidence, written by professors at Harvard Business School (HBS) & MIT Sloan and published in The Journal of Financial Economics.
[2] Performance represents the price performance of each stock during the time in which it was on the Focus List Stocks: Long Model Portfolio in 2021. For stocks removed from the Focus List in 2021, performance is measured from the beginning of 2021 through the date the ticker was removed from the Focus List. For stocks added to the Focus List in 2021, performance is measured from the date the ticker was added to the Focus List through December 31, 2021.
[3] Performance includes the 1745% increase in GME stock price during its time on the focus list in 2021.


