We closed SPR on November 10, 2023. A copy of the associated Position Close report is here.
We closed VZ on August 3, 2023. A copy of the associated Position Close report is here.
Our Focus List Stocks: Long Model Portfolio outperformed the S&P 500 by 35% in 2021. Yet, some stocks still underperformed. Sometimes a pick is just wrong, and we close the position. In other cases, the market takes longer to recognize the value in a business, but the potential gain is worth the wait. We’re starting 2022 by looking at three Focus List stocks that underperformed in 2021 but that we remain bullish on. Next week, we’ll review our best performers.
The Walt Disney Company (DIS: $156/share), Verizon Communications, Inc. (VZ: $53/share), and Spirit AeroSystems Holdings, Inc. (SPR: $47/share) are three Focus List: Long Stocks that await their day in the sun.
Focus List Stocks Outperformed in 2021
The Focus List Stocks: Long Model Portfolio contains the “best of the best” of our Long Ideas, and leverages superior fundamental data, as proven in The Journal of Financial Economics[1], which provides a new source of alpha. This Model Portfolio is available to Pro and higher members.
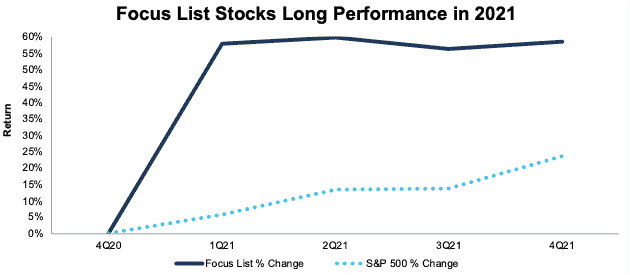
The Focus List Stocks: Long Model Portfolio returned[2],[3], on average, 58% in 2021 compared to 23% for the S&P 500, per Figure 1.
Figure 1: Focus List Stocks: Long Model Portfolio Performance from Period Ending 4Q20 to 4Q21
Sources: New Constructs, LLC
Because our Focus List Stocks: Long Model Portfolio represents the best of the best picks, not all Long Ideas we publish make the Model Portfolio. We published 66 Long Ideas in 2021 but added just six stocks to the Focus List Stocks: Long Model Portfolio during the year. Currently, the Focus List Stocks: Long Model Portfolio has 39 stocks.
Figure 2 shows a more detailed breakdown of the Model Portfolio’s performance, which encompasses all the stocks that were in the Model Portfolio at any time in 2021.
Figure 2: Performance of Stocks in the Focus List Stocks: Long Model Portfolio in 2021
Sources: New Constructs, LLC
Performance includes the performance of stocks currently in the Focus List Stocks: Long Model Portfolio, as well as those removed during the year, which is why the number of stocks in Figure 2 (45) is higher than the number of stocks currently in the Model Portfolio (39).
Underperforming Focus List Stock 1: Disney (DIS): Down 15% vs. S&P 500 Up 27% in 2021
We added Disney to our Focus List Stocks: Long Model Portfolio in November 2017, and while it underperformed the market in 2021, it still offers ample upside given that the company is poised for long-term profit growth. See our most recent report on Disney here.
Main Reason for Underperformance: Slowing Subscriber Growth: While Disney grew its Disney+ subscribers by 60% in fiscal 2021, growth is slowing. The firm added 2.1 million Disney+ subscribers in fiscal 4Q21, which was down from 12.6 million in the prior quarter. Total subscribers were 118.1 million, which was well below Wall Street expectations of 125 million. Disappointed investors sent Disney shares 19% lower in the three weeks following the news on November 10, 2021.
Why Disney Holds Strong Upside: Unmatched Ability to Create and Monetize Content: Disney not only has extensive experience in creating high-quality content and some of the most recognizable brands in the world, but it also monetizes that content through multiple cash-generating channels. In fact, Disney generated a cumulative $10.8 billion positive free cash flow (FCF) in fiscal 2020 and fiscal 2021. For comparison, Netflix burned -$943 million in FCF over the same time.
In addition to its ability to monetize content and generate positive cash flows, the following characteristics position Disney for long-term profit growth:
- live content is a key differentiator in the streaming wars
- parks and cruises will rebound beyond pre-covid levels
Best of all, the expectations for future profit growth baked into Disney’s stock price remain overly pessimistic, which means Disney is undervalued.
Current Price Implies ROIC Only Reaches 2011 Levels: We use our reverse discounted cash flow (DCF) model to quantify the expectations for Disney’s future ROIC baked into its current stock price.
If we assume Disney’s:
- NOPAT margin improves to 11% in fiscal 2022, 16% in fiscal 2023, and 18% from fiscal 2024 to 2031 (vs. 20% before the 21st Century Fox acquisition),
- invested capital turns average 0.5 (compared to 0.4 TTM and 0.7 the year before the Fox acquisition) from fiscal 2022 to 2031,
- revenue grows at a 10% CAGR from fiscal 2022 to 2024 (below consensus estimate CAGR of 14% from fiscal 2022 to 2024), and
- revenue grows at 4% a year from fiscal 2025 to 2031, then
The stock is worth $157/share today – nearly equal to the current price. In this scenario, Disney’s ROIC in fiscal 2031 only reaches 2011 levels of 9%. See the math behind this reverse DCF scenario.
31% Upside if Consensus is Right: Disney’s stock has significant upside If we assume Disney’s:
- NOPAT margin improves to 11% in fiscal 2022, 15% in fiscal 2023, and 20% from fiscal 2024 to 2031 (equal to pre-Fox acquisition margin),
- invested capital turns average 0.5 from fiscal 2022 to 2031
- revenue grows at a 14% CAGR from fiscal 2022 to 2024 (equal to consensus estimate CAGR over same time), and
- revenue grows at 5% a year from fiscal 2025 to 2031
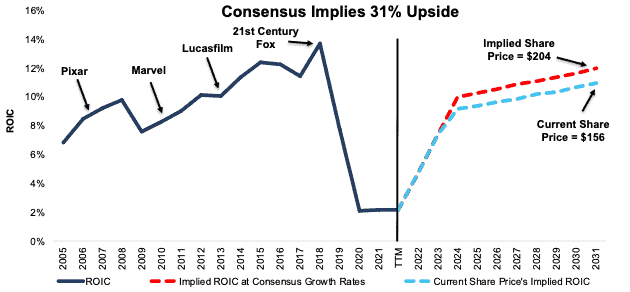
In this scenario, DIS is worth $204/share today – a 31% upside to the current price. In this scenario, Disney grows NOPAT by 7% compounded annually from fiscal 2018 (before Fox acquisition) to fiscal 2031. See the math behind this reverse DCF scenario. For reference, Disney grew NOPAT 9% compounded annually from fiscal 2005 to 2018. Even though Disney’s ROIC improved after its three large acquisitions before 21st Century Fox, Disney’s ROIC in fiscal 2031 equals 11% in this scenario and is lower than its pre-Fox-acquisition ROIC of 14%.
This assumption could prove overly conservative since the Fox acquisition gives Disney a much larger content base to monetize, in which case Disney would have even more upside.
Figure 3 shows Disney’s historical and implied ROIC in each of the scenarios detailed above.
Figure 3: Disney’s Historical and Implied ROIC
Sources: New Constructs, LLC and company filings
Underperforming Focus List Stock 2: Verizon (VZ): Down 12% vs. S&P 500 Up 27% in 2021
We added Verizon to the Focus List Stocks: Long Model Portfolio in September 2019, and despite the underperformance of its stock price in 2021, Verizon continues to create shareholder value. The company’s economic earnings have grown from $10.3 billion in 2016 to $17.7 billion over the trailing-twelve-months (TTM) and maintains attractive risk/reward for investors. See our most recent report on Verizon here.
Main Reason for Underperformance: Falling Free Cash Flow: Verizon’s large investments in purchasing the spectrum rights and developing its 5G network drove a substantial increase in its invested capital. The company’s invested capital over the TTM is 15% above 2020 levels and resulted in FCF falling from $17.8 billion to -$24.6 billion. Verizon’s decline in FCF fuels concerns about the firm’s ability to fund its attractive annualized dividend of 4.9%. However, as noted in our most recent report, such investment is required to build a network to capitalize on growing high-speed data demand and should pay off for many years to come.
Verizon is already seeing signs that it will successfully monetize its deployment of invested capital as it leverages its upgraded network by moving customers to higher-value unlimited and unlimited premium plans. 90% of new accounts in 3Q21 were unlimited with ~45% of new accounts opting for unlimited premium plans. For reference, only 70% of Verizon’s current customer base is on unlimited plans while just 30% of its customers use unlimited premium plans.
Why Investors Shouldn’t Overlook Verizon: Best-in-Class Network Provides Significant Barrier to Entry: Verizon’s purchase of $45 billion worth of C-band licenses positions the firm to expand and improve the quality of its 5G network. Verizon’s focus on maintaining its superior network experience enables it to keep existing customers and attract others from inferior networks. An improved network also positions the firm to capitalize on the data demand created by an increasingly streaming-centric world. To say the least, demand for ever larger bandwidth is growing and will continue to grow for the foreseeable future.
Verizon’s quality network drives low customer churn rate and ultimately results in profitability superior to its peers. Verizon’s TTM ROIC of 7% is well above T-Mobile’s (TMUS) and AT&T’s (T) ROICs of 5% and 4%, respectively.
Current Price Implies Profits Fall 31%: We use our reverse DCF model and find Verizon is priced as if profits will permanently fall from current levels.
If we assume Verizon’s:
- NOPAT margins falls to 17% (10-year average vs. TTM of 20%) from 2021 to 2030 and
- revenue falls 2% compounded annually from 2021 to 2030, then
the stock is worth $52/share today – nearly equal to the current price. In this scenario, Verizon’s NOPAT in 2030 is 31% below TTM levels. See the math behind this reverse DCF scenario.
Verizon Has 125% Upside Even with Minimal Growth: If Verizon:
- maintains TTM NOPAT margins of 20%,
- grows revenue at a 2% CAGR (equal to 2021 to 2023 consensus CAGR) from 2021 to 2023, and
- grows revenue 1% compounded annually from 2024 to 2030, then
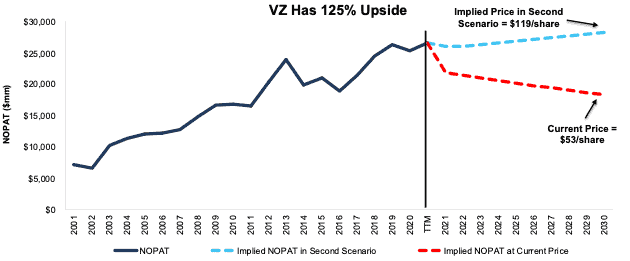
the stock is worth $119/share today – a 125% upside to the current price.
In this scenario, Verizon’s NOPAT grows just 1% compounded annually over the next decade. For reference, Verizon grew NOPAT by 4% compounded annually over the past 10 years. See the math behind this reverse DCF scenario.
Figure 4 shows Verizon’s historical and implied NOPAT in each of the above scenarios. Should Verizon grow NOPAT more in line with historical growth, the upside in the stock is even greater.
Figure 4: Verizon’s Historical and Implied NOPAT
Sources: New Constructs, LLC and company filings
Underperforming Focus List Stock 3: Spirit AeroSystems (SPR): Up 10% vs. S&P 500 Up 27% in 2021
We added Spirit AeroSystems to the Focus List Stocks: Long Model Portfolio in November 2017, and while its stock price underperformed the S&P 500 by 17% in 2021, the company is positioned to continue its recovery from pandemic-induced disruptions to its business. See our most recent report on Spirit AeroSystems here.
Main Reason for Underperformance: Deliveries Remain Well Below Pre-Pandemic Levels: Spirit AeroSystems’ deliveries for the nine-months ended 3Q21 are up 8% year-over-year (YoY) but remain 44% below the comparable period in 2019. The firm is a major supplier of fuselages to Boeing, so its pipeline of business has been affected by the travails of the 737 Max. With nearly one-third of Boeing’s 737 Max inventory belonging to Chinese airlines, China’s reluctance to recertify the aircraft has slowed what was already expected to be a long recovery.
Why Spirit AeroSystems Can Still Fly: Long-Term Demand Ensures a Bright Future: While Spirit AeroSystems’ experienced large disruptions to its operations due to COVID-19, over the long term, we still believe the company is positioned to return to pre-pandemic production levels.
Boeing is on pace to more than double the number of deliveries it made in 2020 and once Spirit AeroSystems works through its own inventory surplus, Boeing’s increased deliveries will translate to more orders and profits for the company.
In addition to an expected recovery in deliveries, Spirit AeroSystems benefits from:
- a strong liquidity position
- long-term tailwinds of rising narrow-body jet demand
- exclusive supplier agreements with Boeing
- high switching costs for 737 Max customers
- widespread approval for 737 Max flight resumption
Current Price Implies Profits Never Reach Pre-Pandemic Levels: We use our reverse DCF model to show how low the future cash flow expectations baked into the current stock price are.
If we assume Spirit AeroSystems:
- achieve an average NOPAT margin of -2% (vs. -9% TTM) from 2021 to 2023,
- improves NOPAT margins to 8% (equal to 2019) from 2023-2030,
- grows revenue at a 17% CAGR (below consensus 2021 to 2023 CAGR of 25%) from 2021 to 2023, and
- grows revenue 3% compounded annually from 2023 to 2030, then
the stock is worth $45/share today – equal to the current price. In this scenario, Spirit AeroSystems’ NOPAT in 2030 is still 14% below 2019 levels. See the math behind this reverse DCF scenario.
Spirit AeroSystems Has 70% Upside at Consensus Estimates: If Spirit AeroSystems:
- achieves an average NOPAT margin of -2% (vs. -9% TTM) from 2021 to 2023,
- improves NOPAT margin to 8% (equal to 2019) from 2023-2030,
- grows revenue at a 25% CAGR (equal to consensus 2021 to 2023 CAGR) from 2021 to 2023, and
- grows revenue 3% compounded annually from 2023 to 2030, then
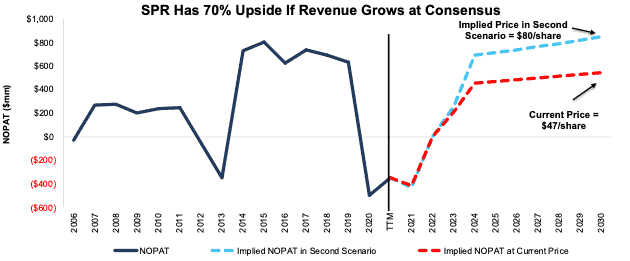
SPR is worth $80/share today – a 70% upside to the current price. In this scenario, Spirit AeroSystems’ NOPAT grows just 3% compounded annually from 2019 to 2030. For reference, Spirit AeroSystems grew NOPAT 12% compounded annually from 2009 to 2019. See the math behind this reverse DCF scenario.
Figure 5 shows Spirit AeroSystems’ historical and implied NOPAT in each of the above scenarios. Should Spirit AeroSystems grow NOPAT more in line with historical growth, the upside in the stock is even higher.
Figure 5: Spirit AeroSystems’ Historical and Implied NOPAT
Sources: New Constructs, LLC and company filings
This article originally published on January 5, 2022.
Disclosure: David Trainer, Kyle Guske II, and Matt Shuler receive no compensation to write about any specific stock, sector, style, or theme.
Follow us on Twitter, Facebook, LinkedIn, and StockTwits for real-time alerts on all our research.
[1] Our research utilizes our Core Earnings, a more reliable measure of profits, as proven in Core Earnings: New Data & Evidence, written by professors at Harvard Business School (HBS) & MIT Sloan and published in The Journal of Financial Economics.
[2] Performance represents the price performance of each stock during the time in which it was on the Focus List Stocks: Long Model Portfolio in 2021. For stocks removed from the Focus List in 2021, performance is measured from the beginning of 2021 through the date the ticker was removed from the Focus List. For stocks added to the Focus List in 2021, performance is measured from the date the ticker was added to the Focus List through December 31, 2021.
[3] Performance includes the 1745% increase in GME stock price during its time on the focus list in 2021.


