
We are more than halfway through the earnings season, and the results have been record-beating and stocks are hitting all-time highs.
For those who wonder if everything is as optimal as the markets suggest, our CEO David Trainer has been hosting Earnings Watch Parties the last few weeks.
The parties focus on revealing the truth hidden behind companies’ earnings reports. He dives into the biggest and most popular companies’ earnings (e.g. $ABNB, $AMZN, $CSCO, $DASH, $LYFT and more) as well as stocks requested by the audience. David unveils the real cash flows of the business and how they compare to the expectations for future cash flows baked into their stock prices. In these sessions you get a 30-minute free trial to our Institutional Members-only reverse discounted cash flow (DCF) model. Register here for the next one.
One way to protect your portfolio during any market cycle, including throughout earnings season, is to invest in companies with consistent and growing dividends that generate enough free cash flow (FCF) to afford those dividend payments. This week’s free stock pick does just that.
The report below is not as in depth as a Long Idea report, but it will give you a good understanding of how our research combines fundamental research with expectations investing.
We hope you enjoy this free research on this month’s featured stock for the Dividend Growth Model Portfolio. Feel free to share this report with friends and colleagues.
We update this Model Portfolio monthly. January’s Dividend Growth Model Portfolio was updated and published for clients on January 30, 2025.
Stock Feature for January: Allstate Corp (ALL: $189/share)
Allstate Corp (ALL) is the featured stock in January’s Dividend Growth Model Portfolio.
Allstate has grown revenue and net operating profit after tax (NOPAT) by 8% and 9% compounded annually, respectively, over the last five years. The company’s NOPAT margin increased from 6.3% in 2018 to 6.6% in the TTM, while invested capital turns rose from 1.5 to 2.6 over the same time. Rising NOPAT margins and invested capital turns drive return on invested capital (ROIC) from 10% in 2018 to 17% in the TTM.
Figure 1: Allstate’s Revenue & NOPAT Since 2018
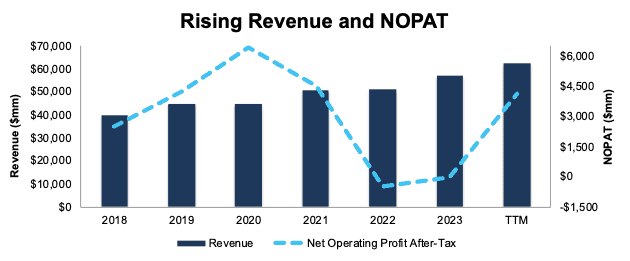
Sources: New Constructs, LLC and company filings
Free Cash Flow Supports Dividend Payments
Allstate has increased its regular, quarterly dividend from $0.46/share in 1Q18 to $0.92/share in 4Q24. The quarterly dividend, when annualized, equals $3.68/share and provides a 1.9% dividend yield.
More importantly, Allstate’s cumulative free cash flow (FCF) easily exceeds its dividend payments. From 2018 through 3Q24, Allstate generated $19.6 billion (38% of current enterprise value) in FCF while paying $5.4 billion in dividends. See Figure 2.
Figure 2: Allstate’s FCF vs. Dividends Since 2018
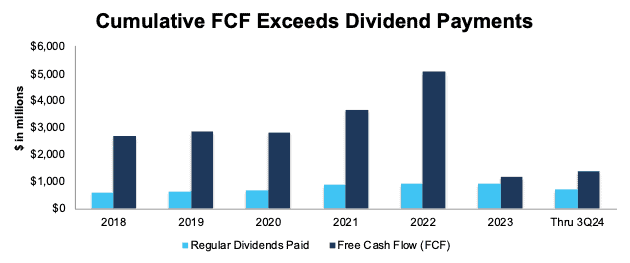
Sources: New Constructs, LLC and company filings
Companies with FCF well above dividend payments provide higher-quality dividend growth opportunities. On the other hand, dividends that exceed FCF cannot be trusted to grow or even be maintained.
ALL Is Undervalued
At its current price of $189/share, Allstate has a price-to-economic book value (PEBV) ratio of 0.8. This ratio means the market expects Allstate’s NOPAT to permanently fall 20% from current levels. This expectation seems overly pessimistic given that Allstate has grown NOPAT by 9% compounded annually and 3% compounded annually over the past five and ten years, respectively.
Even if Allstate’s:
- NOPAT margin falls to 6% (equal to five-year average and below TTM margin of 7%) and
- revenue grows just 3% compounded annually (compared to 6% compounded annually over the last decade) for the next decade,
the stock would be worth $228/share today – a 21% upside. See the math behind this reverse DCF scenario. In this scenario, Allstate’s NOPAT would grow just 1% compounded annually through 2033.
Add in Allstate’s 1.9% dividend yield and a history of dividend growth, and it’s clear why this stock is in January’s Dividend Growth Stocks Model Portfolio.
Critical Details Found in Financial Filings by Our Robo-Analyst Technology
Below are specifics on the adjustments we make based on Robo-Analyst findings in Allstate Inc.’s 10-K and 10-Q:
Income Statement: we made over $550 million in adjustments with a net effect of removing over $250 million in non-operating expense. Clients can see all adjustments made to Allstate’s income statement on the GAAP Reconciliation tab on the Ratings page on our website.
Balance Sheet: we made just over $7 billion in adjustments to calculate invested capital with a net increase of just under $7 billion. The most notable adjustment was for asset write downs. See all adjustments made to Allstate’s balance sheet on the GAAP Reconciliation tab on the Ratings page on our website.
Valuation: we made over $4 billion in adjustments, with a net effect of decreasing shareholder value by over $2 billion. The most notable adjustment to shareholder value was for preferred stock. See all adjustments to Allstate’s valuation on the GAAP Reconciliation tab on the Ratings page on our website.
This article was originally published on February 14, 2025.
Disclosure: David Trainer, Kyle Guske II, and Hakan Salt receive no compensation to write about any specific stock, style, or theme.
Questions on this report or others? Join our online community and connect with us directly.