
One of our favorite investment strategies is to find companies that link executive pay to shareholder value creation. When executives are truly incentivized to create value for shareholders, investors can trust management to act in their best interest. Trust in corporate management is not something to take for granted these days.
The sad truth is that many executives get paid no matter how much value they destroy because their pay is linked to metrics that lead to shareholder value creation. Examples of the wrong kinds of metrics to link to executive pay are:
- Reported Earnings
- Adjusted Earnings
- EBITDA – any form of EBITDA
- Revenue
- ROE
- And more.
The best metric for measuring shareholder value and the best metric to link to compensation is return on invested capital (ROIC). ROIC has a the largest impact on valuation, yet not many companies use it in their executive compensation plans. It’s the truest measure of a company’s profitability that takes into account both the operational and the balance sheet efficiency of a company. Companies that earn the most profit per dollar of capital invested should be rewarded with higher valuations – that’s the purpose of the capital markets.
Our Exec Comp Aligned with ROIC Model Portfolio only includes companies that align their executive compensation with ROIC (or acceptable variants). As David Trainer, our CEO, said many times in this special training, the Exec Comp Aligned with ROIC Model Portfolio provides you with companies and stocks you can trust the most.
We are proud to offer the Exec Comp Aligned with ROIC Model Portfolio. And, we are excited to give you a free stock pick from this Model Portfolio.
The goal behind sharing these free features with you is to deliver insight into the uniquely high value-add of our research. We want you to know how hard we work and how we do research, so you know how reliable research looks and how real AI and machine learning work.
We update this Model Portfolio monthly, and February’s Exec Comp Aligned with ROIC Model Portfolio was updated and published for clients on February 14, 2025.
Stock Feature for February: EOG Resources (EOG: $135/share)
EOG Resources (EOG) is the featured stock in February’s Exec Comp Aligned with ROIC Model Portfolio.
EOG Resources has grown revenue and net operating profit after tax (NOPAT) by 5% and 11% compounded annually, respectively, since 2013. The company’s NOPAT margin improved from 16% in 2013 to 30% over the trailing-twelve-months (TTM). Invested capital turns remained the same at 0.5 over the same time. Rising NOPAT margins drive the company’s return on invested capital (ROIC) from 8% in 2013 to 15% in the TTM.
Figure 1: EOG Resources’ Revenue & NOPAT: 2013 – TTM
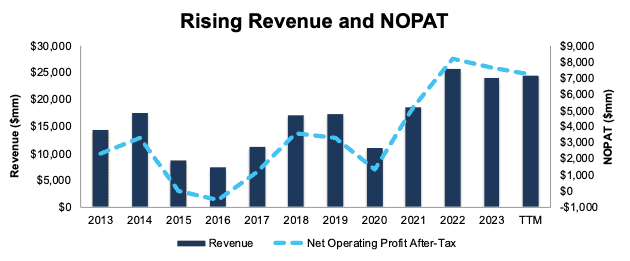
Sources: New Constructs, LLC and company filings
Executive Compensation Properly Aligns Incentives
EOG Resources’ executive compensation plan aligns the interests of executives and shareholders by using “Return on Capital Employed” as a multiple modifier to its annual performance unit awards, according to the company’s proxy statement. The ROCE modifier can adjust the total shareholder return payout by a factor of minus 70% to plus 70%.
The company’s inclusion of ROCE, a variation of ROIC, as a performance goal has helped create shareholder value by driving higher ROIC and economic earnings. When we calculate ROIC using our superior fundamental data, we find that EOG Resources’ ROIC has increased from 8% in 2013 to 15% in the TTM. Economic earnings rose from $1.2 billion to $3.8 billion over the same time. For more stock picks like this one, check out our latest free training on the Golden Metric for picking stocks and learn how to get our top pick for 2025.
Figure 2: EOG Resources’ ROIC & Economic Earnings: 2013 – TTM
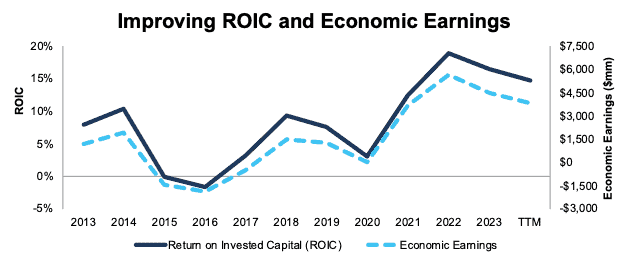
Sources: New Constructs, LLC and company filings
EOG Has Further Upside
At its current price of $135/share, EOG has a price-to-economic book value (PEBV) ratio of 0.8. This ratio means the market expects EOG Resources’ NOPAT to permanently fall 20% from current levels. This expectation seems overly pessimistic for a company that has grown NOPAT 13% compounded annually since 2018 and 11% since 2013.
Even if EOG Resources’
- NOPAT margin falls to 22% (below TTM NOPAT margin of 30%) and
- revenue grows 3% (below ten-year compound revenue growth of 5%) compounded annually through 2033 then,
the stock would be worth $163/share today – a 21% upside. See the math behind this reverse DCF scenario. In this scenario, EOG Resources’ NOPAT would fall 1% compounded annually from 2024 through 2033.
Should the company grow NOPAT more in line with historical growth rates, the stock has even more upside.
Critical Details Found in Financial Filings by Our Robo-Analyst Technology
Below are specifics on the adjustments we made based on Robo-Analyst findings in EOG Resources’ 10-Ks and 10-Qs:
Income Statement: we made over $700 million in adjustments with a net effect of removing over $50 million in non-operating expenses. Professional members can see all adjustments made to EOG Resources’ income statement on the GAAP Reconciliation tab on the Ratings page on our website.
Balance Sheet: we made over $20 billion in adjustments to calculate invested capital with a net increase of over $7 billion. One of the most notable adjustments was several million in asset write downs. Professional members can see all adjustments made to EOG Resources’ balance sheet on the GAAP Reconciliation tab on the Ratings page on our website.
Valuation: we made over $16 billion in adjustments with a net decrease of over $5 billion to shareholder value. The most notable adjustment to shareholder value was deferred tax liability. Professional members can see all adjustments to EOG Resources’ valuation on the GAAP Reconciliation tab on the Ratings page on our website.
This article was originally published on February 21, 2025.
Disclosure: David Trainer, Kyle Guske II, and Hakan Salt receive no compensation to write about any specific stock, style, or theme.
Questions on this report or others? Join our online community and connect with us directly.