
Companies report a wide array of performance metrics, ranging from GAAP to adjusted non-GAAP figures. The unregulated leeway management has in making up metrics makes getting the truth about profits increasingly difficult.
Many papers and case studies demonstrate how companies and Wall Street use “black box” metrics to fool investors. Remember “community adjusted EBITDA” from WeWork! Enron, Valeant, WorldCom, Tyco – they all presented “adjusted” metrics as cover for cooking the books.
Amid this noise, we are proud to provide you one metric that works for all companies in all environments. This metric has also been adjusted to remove all the tricks companies use to manipulate their earnings. This metric is return on invested capital (ROIC). Improving ROIC is highly correlated with increasing shareholder value, because ROIC, when calculated correctly, offers the most accurate and objective view of a firm’s economic performance.
If improving ROIC is correlated with increasing shareholder value, then shouldn’t management be incentivized to improve ROIC? We think so. Firms that tie ROIC to executive compensation link executives’ interests with shareholders’ interests. Plus, attention to ROIC promotes intelligent capital allocation.
Our Exec Comp Aligned with ROIC Model Portfolio includes only those stocks that (1) receive an Attractive-or-better rating and (2) directly link executive compensation to ROIC. We believe this combination signals disciplined capital allocation and a strong investment upside potential.
We are proud to offer the Exec Comp Aligned with ROIC Model Portfolio, and we are excited to give you a free stock pick from this Model Portfolio.
The goal behind sharing these free stock picks with you is to deliver insight into the uniquely high value-add of our research. We want you to know how hard we work and how we do research, so you know what you should expect from a good research provider and how real AI works.
We update this Model Portfolio monthly, and May’s Exec Comp Aligned with ROIC Model Portfolio was updated and published for clients on May 15, 2025.
Free Stock Pick for May: Halliburton Company (HAL: $20/share)
Halliburton’s has grown revenue and net operating profit after tax (NOPAT) by 11% and 23% compounded annually since 2020, respectively. The company’s NOPAT margin improved from 9% in 2020 to 13% in the TTM and invested capital turns increased from 0.6 to 0.8 over the same time. Rising NOPAT margins and IC turns drive the company’s return on invested capital (ROIC) from 5% in 2020 to 11% in the TTM.
Figure 1: Halliburton’s Revenue & NOPAT: 2020 – TTM
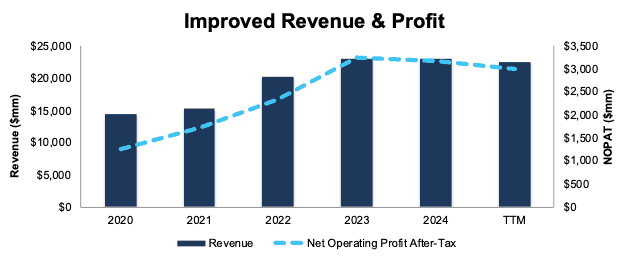
Sources: New Constructs, LLC and company filings
Executive Compensation Properly Aligns Incentives
Halliburton’s executive compensation plan aligns the interests of executives and shareholders by tying a portion of its long-term incentive compensation to return on capital employed (ROCE), according to the company’s proxy statement.
The company’s inclusion of ROCE, a variation of ROIC, as a performance goal has helped create shareholder value by driving higher ROIC and economic earnings. When we calculate ROIC using our superior fundamental data, we find that Halliburton’s ROIC has increased from 6% in 2019 to 11% in the TTM. Economic earnings rose from $233 million to $1 billion over the same time.
Figure 2: Halliburton’s ROIC & Economic Earnings: 2019 – TTM
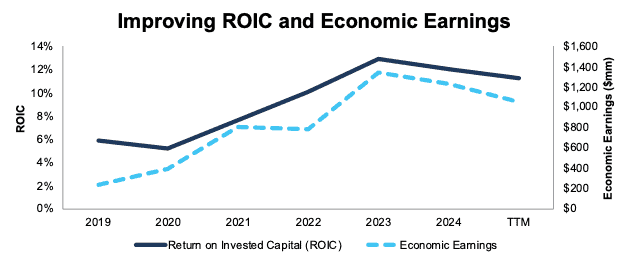
Sources: New Constructs, LLC and company filings
HAL Has Further Upside
At its current price of $20/share, HAL has a price-to-economic book value (PEBV) ratio of 0.5. This ratio means the market expects Halliburton’s NOPAT to permanently fall 50% from current levels. This expectation seems overly pessimistic for a company that has grown NOPAT 13% and 5% compounded annually since 2019 and 2009, respectively.
Even if Halliburton’s
- NOPAT margin falls to 9% (below 12% five-year average and 13% TTM NOPAT margin) and
- revenue grows just 0.5% (below 15-year compound annual revenue growth of 3%) compounded annually through 2034 then,
the stock would be worth $26/share today – a 30% upside. Contact us for the math behind this reverse DCF scenario. In this scenario, Halliburton’s NOPAT would fall 4% compounded annually from 2025 through 2034.
Should the company grow NOPAT more in line with historical growth rates, the stock has even more upside.
Critical Details Found in Financial Filings by Our Robo-Analyst Technology
Below are specifics on the adjustments we made based on Robo-Analyst findings in Halliburton’s 10-K and 10-Qs:
Income Statement: we made over $1 billion in adjustments with a net effect of removing just under $700 million in non-operating expense. Professional members can see all adjustments made to Halliburton’s income statement on the GAAP Reconciliation tab on the Ratings page on our website.
Balance Sheet: we made just under $15 billion in adjustments to calculate invested capital with a net increase of over $6 billion. One of the most notable adjustments was for asset write downs. Professional members can see all adjustments made to Halliburton’s balance sheet on the GAAP Reconciliation tab on the Ratings page on our website.
Valuation: we made just under $10 billion in adjustments with a net decrease of over $8 billion to shareholder value. The most notable adjustment to shareholder value was total debt. Professional members can see all adjustments to Halliburton’s valuation on the GAAP Reconciliation tab on the Ratings page on our website.
This article was originally published on May 22, 2025.
Disclosure: David Trainer, Kyle Guske II, and Hakan Salt receive no compensation to write about any specific stock, style, or theme.
Questions on this report or others? Join our online community and connect with us directly.