
Stock market down, stock market up. Rinse and repeat.
So, what do we know in this uncertain time? We know that we are in the middle of the most important earnings season in the last few years. With each report, we’re learning more about how tariffs affect certain businesses and what to expect for the rest of the year.
How do you cut through the Wall Street spin?
Join our Earnings Watch Parties. In these meetings, we leverage our proven-superior fundamental research to analyze the true earnings of companies. It’s easier to block out the noise when you have the truth at your fingertips.
Speaking of important truths, dividend-paying stocks can only provide a safe-haven if the company generates enough cash to cover its dividends. Our Safest Dividend Yields Model Portfolio only holds stocks that meet that criterion. When paired with an Attractive-or-better rating, we think the stocks in this portfolio can outperform in the current market and beyond.
Below you will find a free stock pick from the April edition of our Safest Dividend Yields Model Portfolio. This summary is not a full Long Idea report, but it will give you insight into the rigor of our research and approach to picking stocks.
Feel free to share this report with friends and colleagues.
We update this Model Portfolio monthly. April’s Safest Dividend Yields Model Portfolio was updated and published for clients on April 23, 2025.
Free Stock Pick: Bank of NT Butterfield & Son Limited (NTB: $41/share)
Bank of NT Butterfield & Son Limited (NTB) is the featured stock in April’s Safest Dividend Yields Model Portfolio.
Bank of NT has grown revenue and net operating profit after tax (NOPAT) by 10% and 8% compounded annually, respectively, since 2020. The company’s NOPAT margin fell from 30% in 2020 to 28% in the TTM, while invested capital turns rose from 0.4 to 0.5 over the same time. Rising invested capital turns are enough to offset falling NOPAT margin and drive the company’s return on invested capital (ROIC) from 13% in 2020 to 15% in the TTM.
Figure 1: Bank of NT’s Revenue & NOPAT Since 2020
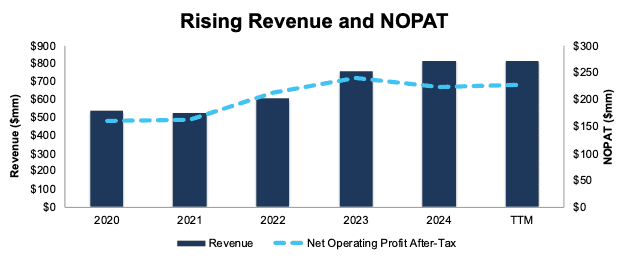
Sources: New Constructs, LLC and company filings
Free Cash Flow Exceeds Regular Dividend Payments
Bank of NT has increased its regular dividend from $0.38/share in 1Q18 to $0.44/share in 1Q25. The current quarterly dividend, when annualized provides a 4.3% dividend yield.
The company’s free cash flow (FCF) easily exceeds its regular dividend payments. From 2020 through 1Q25, the company generated $880 million (49% of current enterprise value) in FCF while paying $448 million in regular dividends. See Figure 2.
Figure 2: Bank of NT’s FCF Vs. Regular Dividends Since 2020
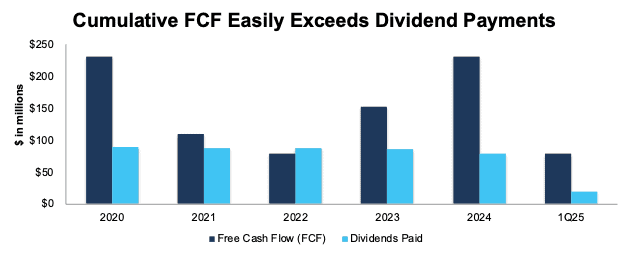
Sources: New Constructs, LLC and company filings
As Figure 2 shows, this company’s dividends are backed by a history of reliable cash flows. Dividends from companies with low or negative FCF are less dependable since the company might not be able to sustain paying dividends.
NTB Is Undervalued
At its current price of $41/share, NTB has a price-to-economic book value (PEBV) ratio of 0.7. This ratio means the market expects the company’s NOPAT to permanently fall 30% from TTM levels. This expectation seems overly pessimistic given that the company has grown NOPAT 2% compounded annually since 2019 (earliest data in our model) and 8% compounded annually since 2020.
Even if the company’s:
- NOPAT margin falls to 20% (below the company’s lowest NOPAT margin of 28%) and
- revenue grows 2% (compared to 6% CAGR over the last five years) compounded annually through 2034,
the stock would be worth $50/share today – a 22% upside. In this scenario, the company’s NOPAT would fall 1% compounded annually through 2034. Contact us for the math behind this reverse DCF scenario.
Should the company’s NOPAT grow more in line with historical growth rates, the stock has even more upside.
Critical Details Found in Financial Filings by Our Robo-Analyst Technology
Below are specifics on the adjustments we make based on Robo-Analyst findings in this featured stock’s 20-F and 6-K:
Income Statement: we made over $25 million in adjustments with a net effect of removing just under $10 million in non-operating expenses. Professional members can see all adjustments made to the company’s income statement on the GAAP Reconciliation tab on the Ratings page on our website.
Balance Sheet: we made over $300 million in adjustments to calculate invested capital with a net increase of over $300 million. The most notable adjustment was for other comprehensive income. Professional members can see all adjustments made to the company’s balance sheet on the GAAP Reconciliation tab on the Ratings page on our website.
Valuation: we made just under $100 million in adjustments to shareholder value, with a net decrease of just under $100 million. The most notable adjustment to shareholder value was for underfunded pensions. Professional members can see all adjustments to the company’s valuation on the GAAP Reconciliation tab on the Ratings page on our website.
This article was originally published on May 2, 2025.
Disclosure: David Trainer, Kyle Guske II, and Hakan Salt receive no compensation to write about any specific stock, style, or theme.
Questions on this report or others? Join our online community and connect with us directly.