
Check out this week’s Danger Zone interview with Chuck Jaffe of Money Life.
For the best financial analysis ratios, look no further. Harvard Business School and MIT Sloan empirically demonstrate the superiority of the data that drives our models and calculations. This paper compares our financial analysis to Bloomberg and Capital IQ (see appendix for details).
Enterprise value to EBITDA (earnings before interest, taxes depreciation, and amortization) is one of the most commonly used valuation ratios. According to a 2015 paper, almost 80% of equity analysts use some form of EV/EBITDA in their analysis. Only the price to earnings (P/E) ratio is more widely used.
Unfortunately, EV/EBITDA has many flaws that can make it misleading. The ratio ignores real costs and liabilities, fails to account for companies with differing tax rates, and misses important distinctions between business models. Investors that rely on EV/EBITDA – and companies like ADT (ADT: $7/share) that look cheap because of it – are in the Danger Zone.
EBITDA Ignores Real Costs…
We recently showed how companies that incentivize executives with EBITDA put shareholders at risk. The main problem with using EBITDA for executive compensation also applies when using it to measure valuation: EBITDA ignores many real costs of doing business.
Depreciation and amortization may not be cash expenses, but companies must still make capital expenditures to replace depreciating capital and remain a going concern. Warren Buffett once said of the EV/EBITDA multiple:
“I’ll look at that figure when you tell me you’ll make all of the future capital expenditures for me.”
ADT is a great example of how depreciation and amortization represent real expenses. From 2016 to 2018, ADT’s EBITDA has grown from $1.5 billion to $2.3 billion, a 50% increase. However, as Figure 1 shows, ADT’s economic earnings – the real cash flows of the business – are negative and declining.
Figure 1: ADT Economic Earnings vs. EBITDA: 2016-2018
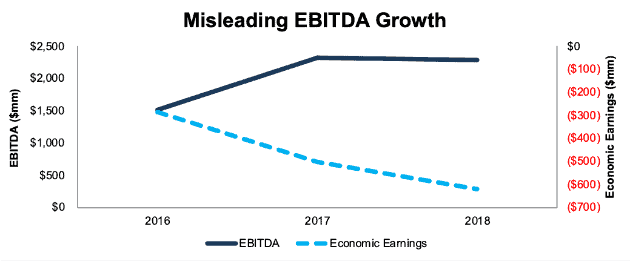
Sources: New Constructs, LLC and company filings.
ADT’s EBITDA growth has been fueled by depreciation & amortization (“D&A”) rising from $1.2 billion in 2016 to $1.9 billion in 2018. As the company excludes more D&A, its EBITDA rises. However, ADT’s capex has increased by a similar amount, from $1 billion in 2016 to $1.8 billion in 2018.
The company’s growing EBITDA doesn’t translate into value for shareholders because so much of its EBITDA is plowed right back in to the business and is lost from shareholders. Further, ADT doesn’t generate enough free cash flow to cover its ~$700 million in annual interest expense.
… And Enterprise Value Ignores Real Liabilities
While the denominator, EBITDA, has issues, so, too, does the numerator, enterprise value. The common calculation of enterprise value is Market Cap + Net Debt. However, this calculation ignores significant liabilities for which investors should account when measuring valuation. ADT has two significant liabilities in the form of:
- $1.3 billion in deferred tax liabilities
- $150 million in off-balance sheet debt
These overlooked liabilities combine for ~10% of unscrubbed enterprise value. Without accounting for these liabilities, ADT appears to have an EV/EBITDA of 6.4. When we add them to enterprise value its EV/EBITDA ratio increases to 7.1. Either way, ADT’s EV/EBITDA remains below the S&P 500 average of 13, but accounting for hidden liabilities does make a significant difference.
Tax Rates Matter Too
Another flaw in EBITDA is that it ignores variation in tax rates from company to company. It assumes that pre-tax cash flows translate into after-tax cash flows at the same rate across the market, but that assumption is simply not true. Based on industry, geographical location, and specific government incentives, different companies will pay significantly different tax rates.
In the case of ADT, the tax benefit from the deductibility of its large interest expense is more than offset by significant non-deductible expenses that result in an above average tax rate. We calculate ADT’s cash tax rate to be 31%, compared to an average of 25% for the market as a whole.
ADT’s higher tax rate helps explain its low EV/EBITDA. If it ever earns enough operating profits to cover its interest costs, the company will have to pay more of its profits to the government.
ROIC Drives Valuation
Ultimately, the problem with using EV/EBITDA is that EBITDA does not drive valuation. Return on invested capital (ROIC) is the real driver of valuation.
Michael Mauboussin does a great job of making this point in his white paper, “What Does an EV/EBITDA Multiple Mean”. He shows that companies with a low ROIC get low EV/EBITDA multiples, while companies with a high ROIC earn high EV/EBITDA multiples. Figure 2 has details.
Figure 2: ROIC Drives Valuation
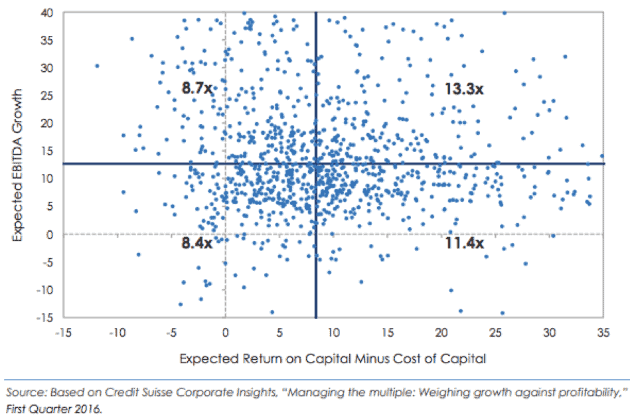
Sources: Blue Mountain Capital Management
These numbers are from 2016, so EV/EBITDA multiples have gone up across the market, but the basic concept remains the same. Companies that earn a high ROIC will warrant much larger EV/EBITDA multiples than companies that earn a low ROIC. This distribution holds true even if the low ROIC company’s EBITDA is growing rapidly.
In the case of ADT, Figure 2 helps to put is valuation in proper context. The company’s EV/EBITDA of 6.4 (or 7.1 accounting for hidden liabilities) looks cheap compared to the S&P 500 average of 13. However, ADT’s ROIC minus its cost of capital is -4% and declining, which would put it near the bottom left corner of Figure 2. In that context, ADT doesn’t look nearly as cheap.
Indeed, when we dig into the future cash flow expectations required to justify its valuation, ADT looks downright expensive. In order to justify its valuation of ~$7/share, ADT must grow after-tax operating profit (NOPAT) by 14% compounded annually for the next 10 years. See the math behind this dynamic DCF scenario. This scenario seems optimistic for a company whose NOPAT declined by 7% in 2018.
If ADT grows NOPAT by 8% compounded annually for the next 15 years, which is still a fairly optimistic scenario, the stock is worth just $1/share today, an 82% downside the current stock price. See the math behind this dynamic DCF scenario.
Valuing stocks based on an EV/EBITDA multiple is not a diligent valuation process. It’s a shortcut for the reverse DCF valuation process. Investors deserve better especially considering the technologies that make more rigorous valuation analysis cheap and easy.
For more details on the flaws of EV/EBITDA and other common valuation metrics, check out our upcoming webinars on Interactive Brokers and TD Ameritrade.
Read our previous article "How EV/EBITDA Misses The Point On Valuation."
This article originally published on April 15, 2019.
Disclosure: David Trainer and Sam McBride receive no compensation to write about any specific stock, style, or theme.
Follow us on Twitter, Facebook, LinkedIn, and StockTwits for real-time alerts on all our research.