For the best financial analysis ratios, look no further. Harvard Business School and MIT Sloan empirically demonstrate the superiority of the data that drives our models and calculations. This paper compares our financial analysis to Bloomberg and Capital IQ (see appendix for details).
Over the past few months we’ve covered how two of the three most popular valuation metrics—price to earnings and price to book—do a poor job of valuing stocks. Now we come to a metric that gets less attention but actually comes in as the second most widely used by equity analysts: enterprise value (EV) to earnings before interest, taxes, depreciation, and amortization (EBITDA).
Nearly 80% of all equity analysts use EV/EBITDA. Many investors and analysts hold it up as the best metric for measuring valuation. They claim it represents the real cash flows of the business.
Figure 1 shows how EBITDA gives the misleading impression that gas station operators CST Brands (CST) is increasing profits when its true profitability as measured by return on invested capital (ROIC) is in sharp decline.
Figure 1: EBITDA Increases But Real Profitability Declines
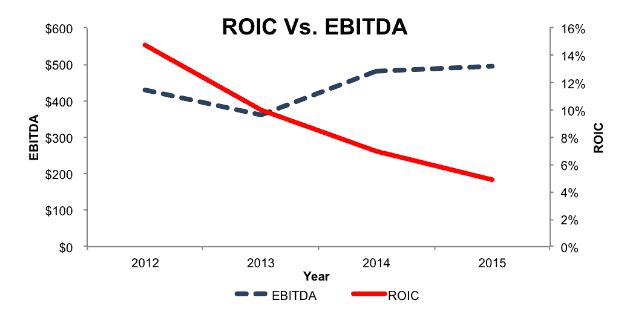
Sources: YCharts, New Constructs, LLC and company filings.
We’ll dig deeper into the structural flaws that make EBITDA so misleading for companies like CST, but first let’s take a look at some of the more basic issues that make EBITDA an unreliable metric.
Accounting Numbers Mislead Investors
The root problem for EV/EBITDA is that, while it makes some minor adjustments, it still relies on the same flawed accounting constructs as the other popular metrics. The way enterprise value is commonly calculated excludes several important liabilities that reduce the total cash flow available to shareholders. Excluding these liabilities creates a misleading picture of a company’s valuation.
AT&T (T), for instance, has a reported EV/EBITDA of 7.46 based on a calculated enterprise value of $348 billion. In our system, we show T with an enterprise value of $473 billion and an EV/EBITDA that is 10.59, significantly higher than the reported value. What explains this $125 billion difference?
- $55 billion in deferred tax liabilities
- $37 billion in underfunded pensions
- $23 billion in off-balance sheet debt
- $1 billion in deferred compensation costs
All these liabilities represent real claims on cash flows (beyond debt and equity) and should be included in the company’s enterprise value.
Removing Taxes Makes No Sense
Intuitively, removing taxes from the equation for EBITDA has a certain amount of logic. Taxes are (mostly) out of a company’s control and can theoretically change significantly in any given year due to political developments.
In reality, most companies have fairly stable cash tax rates, and there are often structural differences between companies in terms of geography, type of business, and the amount of tax-deductible expenses such as R&D. These different tax rates play a large role in the amount of future cash flows available to investors.
As an example, let’s compare Johnson & Johnson (JNJ) and Colgate Palmolive (CL). Last year, JNJ had a cash tax rate of 21%, versus 38% for CL. This difference makes sense, as JNJ earns a number of tax breaks from its various healthcare lines and the billions of dollars it devotes to R&D annually, while CL’s business does not earn those same types of breaks.
Since 2007, JNJ’s cash tax rate has been in a steady band between 20% and 23%. CL’s most recent tax rate is slightly higher than normal, but it’s been above 30% for every year in our model going back to 1998. Clearly there is a persistent and predictable difference between the amount of taxes these two companies have to pay every year. Excluding those taxes leads to misleading comparisons.
Removing Depreciation and Amortization Ignores the Balance Sheet
Empirical research shows that return on invested capital (ROIC) is the most important driver of long-term shareholder value. Investors should evaluate companies on the basis of maximizing ROIC.
Through that lens, EBITDA is a worse metric than GAAP earnings. Removing depreciation and amortization ignores the real cost of capital needed to maintain the business. Ignoring the balance sheet of a business is like excluding the at bats that ended in strikeouts when calculating batting average. The more strikeouts, the more misleading that batting average would be.
The same idea applies to EV/EBITDA and roll-up schemes or companies that grow rapidly through acquisitions. It’s easy to grow EBITDA rapidly when you constantly buy up smaller competitors. By ignoring the balance sheet, EBITDA misses the cost of all that growth. If a company keeps deploying capital at a high rate to buy a small increase in EBITDA, real cash flows will decline.
Big banks have an incentive to keep these roll-up schemes going. They make good profits on both advising on the acquisition (M&A fees) and underwriting of the debt and equity needed to fund the acquisitions.
Gas station operator CST Brands (CST) fits the profile of a roll-up. Since the company was spun out from Valero Energy (VLO) in 2013, it has more than doubled its invested capital, from $1.5 billion to $3.6 billion. Most of this increase has come from acquisitions, which have failed to deliver any real value. In fact, CST’s after-tax profit (NOPAT) has actually decreased over that timeframe, and its ROIC has dropped from 15% to 5%.
By stripping out the $209 million in depreciation and amortization expense that CST incurred last year, however, EBITDA actually shows an increase in profitability, from $429 million in 2012 to $494 million last year. The stock looks cheap with an EV/EBITDA of just 8.5
Looking at free cash flow shows just how misleading that EBITDA number really is. The company has had to significantly boost capex to maintain the business. Along with the acquisition spending, this increased capex has led CST to have nearly $1.7 billion in negative free cash flows over the past three years.
The stock may seem cheap based on EV/EBITDA, but our dynamic DCF model reveals the high expectations embedded in the stock price. In order to justify its valuation of ~$32/share, CST needs to grow NOPAT by 6% compounded annually for the next 12 years.
By pursuing this acquisition strategy, CST’s executives have given the illusion of profitability while actually decreasing cash flow. Don’t just blame the executives though. They’re incentivized to pursue this strategy by a compensation plan that rewards them for maximizing EBITDA.
Cases such as CST show how the popularity of EV/EBITDA isn’t just bad for investors, it’s bad for the economy as a whole. Firms should be aiming to maximize ROIC, and focusing on EBITDA often encourages managers to pursue low-return strategies simply because it boosts their bonuses.
Disclosure: David Trainer and Sam McBride receive no compensation to write about any specific stock, sector, style, or theme.