We closed this position on May 17, 2018. A copy of the associated Position Update report is here.
We’ve often warned of tech companies that have a “recurring revenue” model because, despite high-flying top line growth, they have no profits. This week’s long idea flips that script. Not only does this company provide significant insights into the healthcare service industry, it has done so profitability for over a decade. This profitability, combined with a strong competitive position and an undervalued stock find National Research Corp (NRCIB: $38/share) on October’s Most Attractive Stocks list and also as this week’s Long idea.
Strong Profit Growth at NRCIB
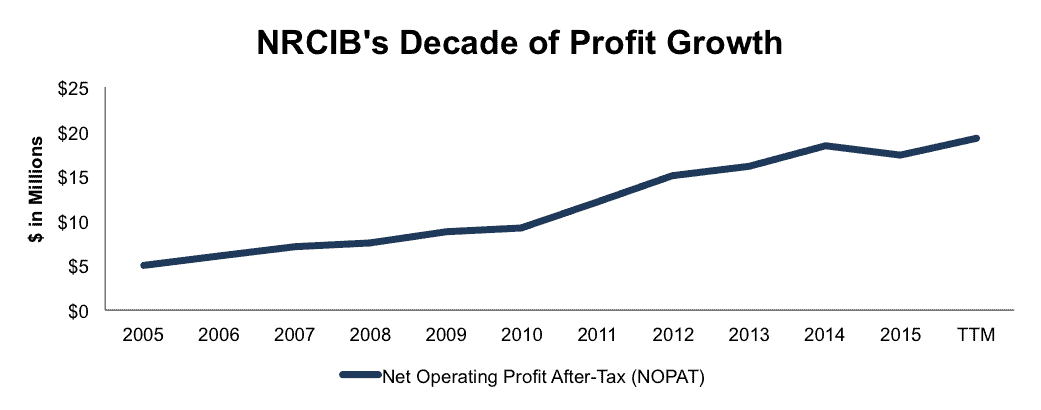
Over the past decade, National Research Corp’s after tax profit (NOPAT) has grown by 14% compounded annually, to $17 million in 2015 and to $19 million over the last twelve months (TTM), per Figure 1. Long-term, NRCIB has grown NOPAT by 15% compounded annually since 1998.
Figure 1: NRCIB’s Growing Profits
Sources: New Constructs, LLC and company filings
NRCIB’s NOPAT has largely grown due to the company’s improving NOPAT margins, which have improved from 15% in 2010 to 18% TTM. At the same time, National Research’s return on invested capital (ROIC) has improved from 14% in 2010 to a top-quintile 27% TTM. Further showcasing the fundamental strength of NRCIB’s business, the company has generated cumulative $99 million in free cash flow (FCF) over the past five years.
Improving ROIC Correlated With Creating Shareholder Value
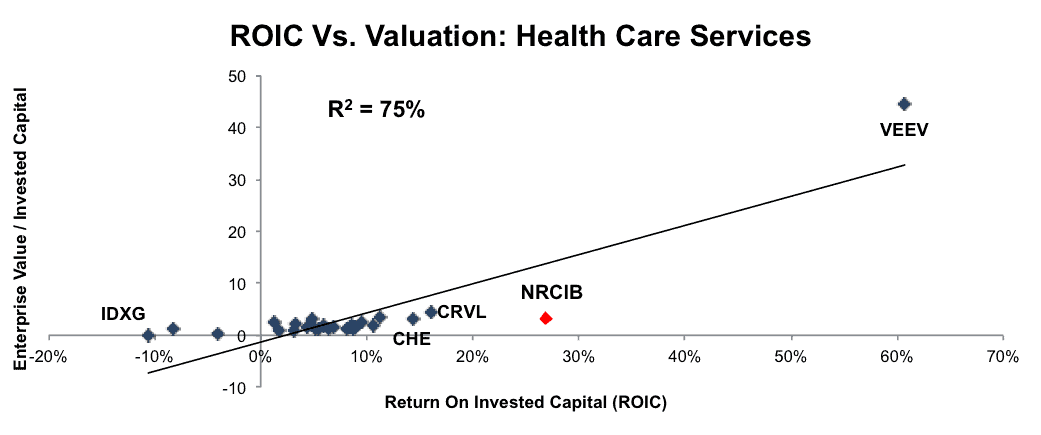
National Research Corp’s 27% ROIC is above the 8% average of the 27 Health Care Services companies currently under coverage. Companies with a top-quintile ROIC tend to have wider moats and, on average, premium valuations. However, NRCIB has not been awarded a premium valuation. Figure 2 shows that ROIC explains 75% of the changes in stock valuation for the 27 Health Care Services companies and that NRCIB is one of the cheapest out of this group.
Figure 2: ROIC Explains 75% Of Valuation for Health Care Service Peers
Sources: New Constructs, LLC and company filings
High Profitability Separates NRCIB From The Pack
NRCIB operates as a data analytics/insights provider to health care organizations. It’s services help measure patient and employee experience while creating actionable insights to improve these interactions. As a data provider, NRCIB has a litany of competitors, including healthcare specific providers like Healthstream (HSTM) and Healthways (HWAY), to more broad analytics firms such as Gartner (IT) or Forrester Research (FORR). Despite the competition, NRCIB has been able to leverage its business model to achieve the highest profitability of the firms listed below in Figure 3. NRCIB’s focus on customer survey data and finding ways to use data to improve healthcare organizations has led to a highly profitable business. With higher profitability, NRCIB maintains a competitive advantage, not only through its leading solutions, but its ability to invest and continually improve its business operations.
Figure 3: NRCIB’s Impressive Profitability
Sources: New Constructs, LLC and company filings.
Bear Concerns Assume Regulation, Not the Innovation That Has Led To Success
As with any company in the healthcare sector, bears will point to the highly regulated nature of the industry as a concern. In the case of NRCIB, bears would argue that Medicare & Medicaid’s requirement that patient satisfaction data be incorporated into reimbursement qualifications created non-recurring profit growth for National Research Corp. However, this train of thought overlooks the longer-term success of NRCIB and the evolving consumer preferences that make its solutions more attractive than ever.
In 2012, the Center for Medicare & Medicaid Services (CMS) began using patient satisfaction surveys as a performance indicator to determine reimbursements. Bears might argue that this change, to measure the value of healthcare provided, created artificial demand for NRCIB’s survey distribution/collection and led to unsustainable profit growth. NRCIB’s history of profit growth before this requirement was put in place suggests otherwise. NRCIB’s NOPAT grew 19% compounded annually from 2001-2011. While the legal regulation surrounding these surveys may have created increased demand, NRCIB was growing profits for years beforehand, and has continued to do so after the regulations were introduced.
Moreover, we think the CMS requirement, along with consumers’ desires for more information/data about their health, creates a significant opportunity for NRCIB that the market is failing to recognize. With many healthcare organizations required to collect, at minimum, patient satisfaction surveys, NRCIB has significant cross-selling opportunities. NRCIB has built up years of experience in not only collecting customer data, but also creating systems that leverage this data to create actionable recommendations for clients. Rather than simply tracking information, NRCIB informs clients how to increase customer satisfaction, customer loyalty, brand perception, and ultimately profits. The new CMS requirement opens more doors for NRCIB to sell services to help clients use the data being collected to understand and improve their businesses. Despite these long-term profit growth opportunities, NRCIB’s current valuation implies permanent profit decline, as we’ll show below
Valuation Implies Collapse In Profits
NRCIB is up just over 8% year to date. However, there remains a disconnect between NRCIB’s valuation and the fundamentals of the business, which means shares are undervalued. At its current price of $38/share, NRCIB has a price to economic book value (PEBV) ratio of 0.7. This ratio means that the market expects NRCIB’s NOPAT to permanently decline by 30% from current levels. This expectation seems overly pessimistic for a firm that has grown NOPAT by 15% compounded annually since 1998.
Even if NRCIB were to never again grow profits from current levels, the economic book value, or no growth value of the firm is $54/share – a 42% upside from current valuation.
However, if NRCIB can maintain 2015 NOPAT margins of 17% (below 18% TTM) and grow NOPAT by just 8% compounded annually for the next five years, the stock is worth $68/share today – a 79% upside. This scenario assumes that NRCIB’s spending on working capital and fixed assets will be 7% of revenue, which is the average change in invested capital as a percent of revenue over the past decade. This scenario also assumes NRCIB can grow revenue by 8% compounded annually over the next five years, which is the average of consensus estimates for 2016 & 2017.
Buy Back Plus Dividend Could Yield 6%
NRCIB already offers an attractive dividend yield of 5%. If the firm repurchases its remaining allotment (69,000 shares) under the repurchase plan initiated in 2006 and amended in 2013, the total yield for investors would be 6%. At the end of 2Q16, National Research Corp has just over 69,000 shares remaining under its current repurchase authorization. This authorization will only expire if terminated by the Board of Directors or unless the firm repurchases the remaining authorization. So far, management has repurchased just over 305,000 shares since the initial authorization in 2006 and amendment in 2013. Through 2016, National Research has not repurchased any class B shares. Even if NRCIB chooses not to repurchase its remaining authorization, investors would still receive the impressive 5% dividend yield.
Rising Health Care Spending Creates Room For Future Profit Growth
From 2015-2025 health spending is projected to grow nearly 6% per year. Increased health spending, along with an aging and longer-living population, means more patients in healthcare organizations, which equates to more data being produced and collected. NRCIB can promote its solutions, through cross selling opportunities, which allow organizations to maximize profits while enhancing customer satisfaction. In fact, the company believes cross selling could be a key to growth, as less than 15% of customers used multiple products in 2015. The combination of rising health care spending and improved cross sales could provide a boost to NRCIB.
Insider Trends and Short Interest Remain Low
Over the past 12 months, there have been no insider sales or purchases of NRCIB. However, over the past 12 months, insiders have purchased 43 thousand A class shares (NRCIA) and sold 28 thousand A class shares for a net effect of 15 thousand shares purchased. Additionally, short interest sits at just over 18 thousand shares, or less than 1% of shares outstanding.
Executive Compensation Should Be Tied To ROIC Rather Than Revenue Growth
National Research Corp’s executive compensation plan, which includes base salary, cash incentives and long-term equity awards, is largely tied to achieving overall revenue and net income targets. While not perfect, NRCIB’s executive compensation plan is much improved over plans that focus solely on non-GAAP metrics. Most importantly, it’s clear that NRCIB’s executive compensation plan has successfully motivated management to create shareholder value, as economic earnings, the true cash flow of the business, have grown from $5 million in 2010 to nearly $16 million TTM. We would prefer National Research Corp tie its executive compensation to ROIC, as there is a strong correlation between ROIC and shareholder value, but as it is, NRCIB’s executive compensation plan raises no red flags.
Impact of Footnotes Adjustments and Forensic Accounting
In order to derive the true recurring cash flows, an accurate invested capital, and a real shareholder value, we made the following adjustments to National Research Corp’s 2015 10-K:
Income Statement: we made just under $2 million of adjustments with a net effect of removing slightly less than $1 million in non-operating expenses (<1% of revenue). We removed less than $1 million related to non-operating expenses and less than $1 million related to non-operating income. See all adjustments made to NRCIB’s income statement here.
Balance Sheet: we made $60 million of adjustments to calculate invested capital with a net decrease of $22 million. One notable adjustment was for $3 million (4% of net assets) related to other comprehensive income. See all adjustments made to NRCIB’s balance sheet here.
Valuation: we made $40 million of adjustments with a net effect of increasing shareholder value by $10 million. The largest adjustment to shareholder value was the removal of $5 million in net deferred tax liability. This adjustment represents 2% of NRCIB’s market cap.
Attractive Funds That Hold NRCIB
There are no funds that receive our Attractive-or-better rating and allocate significantly to National Research Corp.
This report originally published here on October 5, 2016.
Disclosure: David Trainer, Kyle Martone, and Kyle Guske II receive no compensation to write about any specific stock, style, or theme.
Click here to download a PDF of this report.
Scottrade clients get a Free Gold Membership ($588/yr value). Login or open your Scottrade account & find us under Quotes & Research/Investor Tools.


