Markets soared on the news of a preliminary de-escalation in the tariff war between the U.S. and China, with the main indices jumping between 2-3%.
This development had investors screaming buy buy buy, which could indicate a renewed willingness to allocate capital to equities. However, caution remains warranted. The markets could turn on a dime, as they have many times this year. A number of fundamentally weak and overvalued companies continue to trade at unjustifiable valuations, posing serious risks to unsuspecting investors.
This week’s Danger Zone pick highlights a company with a large cash burn and a valuation predicated on highly unrealistic expectations. For instance, the stock’s current price implies the business will simultaneously achieve unprecedented profit growth and a sevenfold increase in market share. This stock represents a material risk to any portfolio.
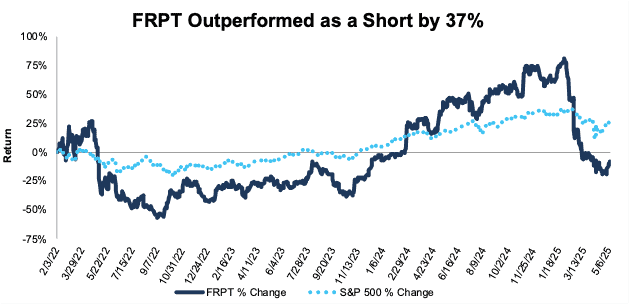
We originally put Freshpet Inc. (FRPT: $80/share) in the Danger Zone on February 2, 2022 and most recently reiterated our bearish opinion on the stock in October 17, 2022. Since our original report, FRPT has outperformed as a short by 37%, falling 10% while the S&P 500 is up 26%.
Despite falling 44% YTD, we’re here to remind you: this stock remains dangerous.
Freshpet’s stock could fall further based on:
- persistently high operating costs,
- large cash burn,
- lagging market share,
- more profitable competitors, and
- a stock valuation that implies Freshpet will grow its market share 7x while also growing profits to levels never seen before.
Figure 1: Freshpet Outperformance as a Short From 2/3/22 Through 5/9/25
Sources: New Constructs, LLC
What’s Working
Freshpet has successfully grown its retail presence and increased its total store count (stores that sell Freshpet products) by 380 from the end of 4Q24 to the end of 1Q25. Similarly, the company’s revenue increased 18% YoY in 1Q25, mainly driven by volume gains of 15% and favorable price/mix of 3%.
Additionally, Freshpet’s adjusted EBITDA increased from $31 million in 1Q24 to $36 million in 1Q25, though we show below why this metric is misleading.
What’s Not Working
Retail improvements and top-line growth aside, Freshpet’s fundamentals remain in very poor shape. The company missed earnings estimates in its 1Q25 report and lowered full-year adjusted EBITDA guidance to the range of $190-$210 million, compared to prior guidance of “at least $210 million”.
Adjusted EBITDA Misleads Investors
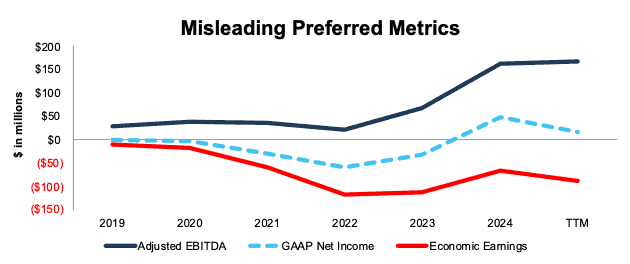
Freshpet’s management provides a misleading view of the company’s profitability when it directs investors to its “Adjusted” EBITDA. From 2019 to the TTM, Freshpet’s Adjusted EBITDA improved from $29 million to $167 million, while its GAAP net income rose from -$1 million to $16 million.
Over the same time, the company’s economic earnings, the true cash flows of the business, fell from -$11 million to -$88 million. It is a big red flag when the company’s preferred non-GAAP metric is rising while its economic earnings are declining, or even worse, when its GAAP net income gets outpaced as well.
The discrepancy between the metrics comes largely from the company removing $8.8 million in non-cash share-based compensation when calculating 1Q25 adjusted EBITDA. For reference, Freshpet’s 1Q25 GAAP net income was -$13 million. The discrepancy should come as no surprise as Freshpet openly admits in earnings releases that “the non-GAAP measures are not and should not be considered an alternative to the most comparable U.S. GAAP measures”. We further detail the issues with Adjusted EBITDA here.
Figure 2: Freshpet’s Adjusted EBITDA vs. Net Income vs. Economic Earnings: 2019 – TTM
Sources: New Constructs, LLC and company filings.
Operating Costs Remain Elevated
Freshpet’s total operating expenses, which include cost of goods sold and selling, general, and administrative expenses have remained high for years. For instance, over the last five years, total operating expenses averaged 106% of revenue.
More recently, Freshpet’s total operating expenses rose from 96% of revenue in 1Q24 to 104% of revenue in 1Q25. The increase was driven by SG&A expenses rising from 36% of revenue to 44% of revenue over the same time.
Consistently Burning Cash
Considering the company’s high operating costs, it should come as no surprise that Freshpet has been and continues to burn cash.
Freshpet’s free cash flow (FCF) has been negative on an annual basis every year in our model (dating back to 2017). On a quarterly basis, Freshpet’s FCF has been negative in 34 of the 36 quarters in our model. The only two quarters with positive FCF occurred in 4Q16 and 2Q18.
From 2019 through 1Q25, Freshpet has burned through a cumulative $1.2 billion (29% of enterprise value) in FCF excluding acquisitions. See Figure 3.
Figure 3: Freshpet’s Cumulative Free Cash Flow Since 2019
Sources: New Constructs, LLC and company filings.
Despite its cash burn rate, we did not make Freshpet a Zombie Stock because its cash on hand can support its TTM cash burn rate for 34 months (more than the 24 months cut off) from the end of May 2025.
Note that Freshpet was a Zombie Stock before Jana Partners, in 4Q22, took a 10% stake in Freshpet and boosted the company’s cash on hand enough to extend its cash burn runway past 24 months. Jana Partners exited its position in Fresphet in 2Q24. Consequently, FRPT is at risk of going back on the Zombie Stock list should its cash burn runway fall below 24 months.
Small Market Share in an Industry Dominated by Giants
Freshpet faces direct competition from both larger companies like Nestle (NSRGY), Mars Inc., General Mills (GIS), Colgate-Palmolive (CL), and Chewy (CHWY), as well as smaller, lesser-known start-ups. Additionally, the company faces heavy competition from private label pet food brands.
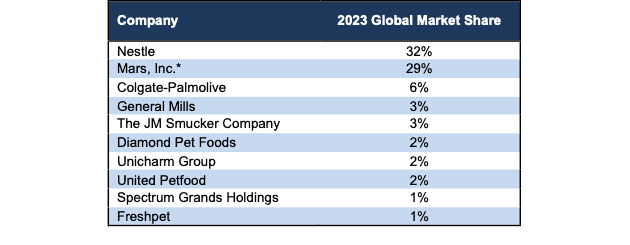
In the most recently available comparable public data (Mars is privately owned and doesn’t disclose pet business sales every year), the pet food market was dominated by Nestle and Mars. In 2023, Nestle (32%) and Mars (29%) combined to make up 61% of the global pet food market. Hill’s Pet Nutrition (owned by Colgate-Palmolive) General Mills (GIS), The J.M. Smucker Company (SJM), rounded out the top five. Freshpet held just over 1% market share. See Figure 4.
Figure 4: Freshpet’s Market Share Compared to Peers
Sources: Research And Markets
Importantly, these companies have significant competitive advantages in the form of larger manufacturing scale, a more extensive distribution network, and other business lines that generate cash to re-invest in the business.
If we analyze estimated market share based on Freshpet’s 2024 sales and the estimated pet food market size in 2024, we find that the company holds just 1% of the estimated market.
Competitors also include general retailers, such as Walmart (WMT), Costco (COST), and Amazon (AMZN), each of which sell their own private label pet brands.
Profitability Is Even Worse
Freshpet not only lags the competition in market share, but also in profitability.
Even though Freshpet achieved a record net operating profit after-tax (NOPAT) of $50 million in 2024, profits have fallen to -$10 million in 1Q25, down from $9 million in 1Q24. Similarly, the company’s return on invested capital (ROIC) hit a peak of 4% in 2024, but has fallen to 2% in the TTM ending 1Q25.
Per Figure 5, Freshpet has the lowest ROIC and one of the lowest NOPAT margins in the industry.
Figure 5: Freshpet’s Profitability Vs. Peers: TTM
Sources: New Constructs, LLC and company filings.
Taking market share in an industry already dominated by larger and more profitable companies will be hard to do, especially considering that Freshpet’s revenue is entirely undiversified or 100% dependent on its pet food sales.
Valuation Implies Freshpet Will Grow Its Market Share 7x
Below, we use our reverse discounted cash flow (DCF) model to analyze the future cash flow expectations baked into Freshpet’s stock price. Freshpet’s stock is priced as if it will grow profits at accelerated rates while also taking huge chunks of market share. We also present additional DCF scenarios to highlight the downside risk in the stock if Freshpet fails to achieve these overly optimistic expectations.
To justify its current price of $80/share, our model shows Freshpet would have to:
- improve its NOPAT margin to 5.2% (equal to the company’s all-time high margin, compared to 3% margin over the TTM) and
- grow revenue by 28% compounded annually (above consensus estimates of 17% in 2025, 19% in 2026, and 18% in 2027) for the next decade.
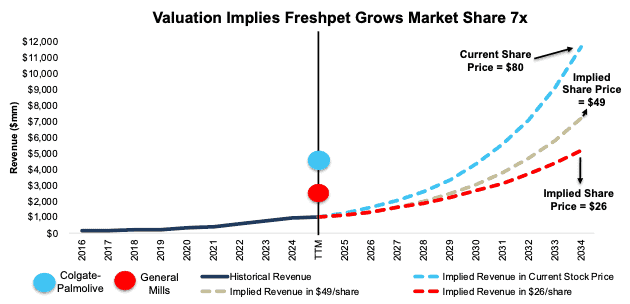
In this scenario, Freshpet would generate $11.7 billion in sales in 2034, which is 12x its TTM sales, 3x Colgate-Palmolive’s TTM pet food sales, and 5x General Mill’s pet food sales.
This scenario also implies Freshpet’s NOPAT would reach $608 million in 2034, compared to the company’s all-time high NOPAT of $50 million and TTM NOPAT of $30 million. Contact us for the math behind this reverse DCF scenario.
The implied sales in this scenario equate to 7% of the forecasted global pet food market in 2034, which is far above the company’s estimated 1% market share in 2024.
Furthermore, companies that grow revenue by 20%+ compounded annually for such a long period are “unbelievably rare”, making the expectations in Freshpet’s share price even more unrealistic.
40%+ Downside Even If Market Share Grows 4x
If we, instead, assume Freshpet:
- immediately improves NOPAT margin to 5.2%,
- grows revenue at consensus rates in 2025 (17%), 2026 (19%), and 2027 (18%), and
- grows 24% compounded annually through 2028 – 2034, then
the stock would be worth $49/share today – a 40% downside to the current price. Contact us for the math behind this reverse DCF scenario.
In this scenario, Freshpet would grow sales to $7.2 billion in 2034, which would be around 8x the company’s TTM sales, 2x Colgate-Palmolive’s TTM pet food sales, and 3x General Mill’s pet food sales.
The implied sales in this second scenario would represent 4% of the pet foods market in 2034, which is 4x the company’s market share in 2024.
65%+ Downside If Revenue Grows at Consensus Growth Rates
If we instead assume Freshpet:
- immediately improves NOPAT margin to 4.0% (still above TTM NOPAT margin of 3.0%),
- grows revenue at consensus estimates in 2025 (17%), 2026 (19%), and 2027 (18%), and
- grows revenue at 18% (equal to 2027 consensus estimate) each year thereafter through 2034, then
the stock would be worth just $26/share today – a 68% downside to the current price. Contact us for the math behind this reverse DCF scenario.
The implied sales in this scenario would still represent 3% of the projected global pet foods market in 2034.
Figure 6 compares Freshpet’s implied future revenue in these scenarios to its historical revenue. For comparison, we include the TTM pet food sales of peers Colgate-Palmolive (CL) and General Mills (GIS).
Figure 6: Freshpet’s Historical and Implied Revenue: DCF Valuation Scenarios
Sources: New Constructs, LLC and company filings.
Stock Is Not Worth $1
Each of the above scenarios assumes Freshpet grows revenue, NOPAT and FCF without increasing working capital or fixed assets. This assumption is highly unlikely but allows us to create best-case scenarios that highlight the unrealistically high expectations embedded in the current valuation. For reference, Freshpet’s invested capital grew 43% compounded annually from 2019 through the TTM. If we assume Freshpet’s invested capital increases at a similar rate in the DCF scenarios above, the downside risk is even larger.
Given that the performance required to justify its current price is overly optimistic, we dig deeper to see if Freshpet is worth buying at any price. The answer is likely no.
The company has $477 million in total debt, $42 million in outstanding employee stock options, and just $226 million excess cash. Freshpet has an economic book value, or no-growth value, of <$1/share. In other words, we do not think equity investors will ever see anywhere close to the level of economic earnings required to justify anything more than $1/share under normal operations.
This article was originally published on May 12, 2025.
Disclosure: David Trainer, Kyle Guske II, and Hakan Salt receive no compensation to write about any specific stock, sector, style, or theme.
Questions on this report or others? Join our online community and connect with us directly.
