
We published an update on this Danger Zone pick on June 23, 2022. A copy of the associated report is here.
We continue to warn investors of the dangers of overlooking reliable fundamental research. Our “Falling Knives” reports (see report #1 of 5) illustrate the perils of ignoring these warnings, especially as 62 of our Danger Zone picks are down 40%+ from their 52-week highs.
This week’s Long Idea serves as a reminder of the critical importance of reliable fundamental research in performing the diligence required to fulfill fiduciary responsibilities and protect portfolios from dangerous stocks such as Freshpet (FRPT: $93/share).
Freshpet aims to disrupt the pet food industry, but the company offers little more than a concept that can be and is easily replicated by competitors large and small. Owning FRPT is extremely risky given the company’s:
- profitless revenue growth
- competition from large incumbents and new entrants
- lack of barriers to entry
- inferior profitability to peers
- negative free cash flow (FCF)
- current valuation implies revenue will grow at a 47% CAGR over the next six years
One-Sided Growth Story
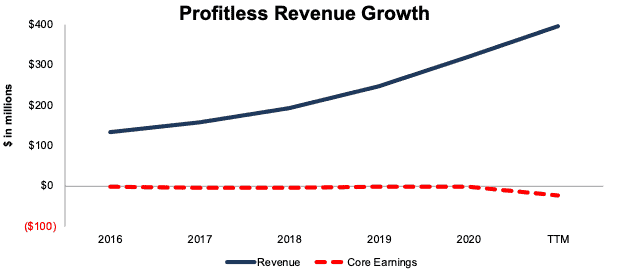
Freshpet’s rapid revenue growth has no doubt gained investors’ attention. The firm has grown revenue 24% compounded annually since 2016, and its growth is accelerating with its preliminary revenue for 2021 of $426 million. Though below its original 2021 guidance, sales grew by 34% over 2020 revenues.
However, Freshpet’s fast top-line growth has come at the expense of the bottom line. Per Figure 1, the firm’s revenue has tripled since 2016, while Core Earnings have fallen in three of the past four years and are -$23 million over the TTM.
Figure 1: Freshpet’s Revenue & Core Earnings Since 2016
Sources: New Constructs, LLC and company filings
Competition Curtails Growth
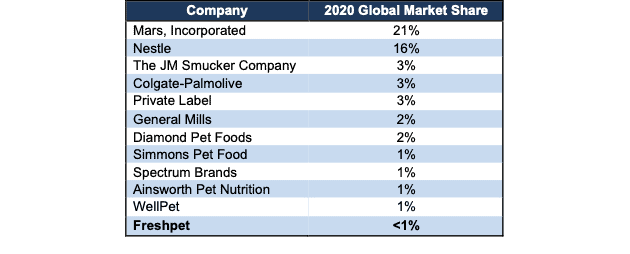
Freshpet faces competition from much larger firms in the pet food industry, such as Mars, Nestle (NSRGY), JM Smucker (SJM), Colgate-Palmolive (CL), General Mills (GS), and more. Most competitors have the important competitive advantages of extensive distribution networks and larger manufacturing scale, which results in larger market share. See Figure 2.
The rise in popularity of the firm’s products is certain to garner more attention from existing competition, which would make growth and market share gains even more difficult.
Figure 2: Leading Pet Food Competitors
Sources: New Constructs, LLC, company filings, Statista, and Allied Market Research
New Entrants Will Also Eat Away at Hopes of Profitability
Freshpet not only faces well-entrenched competition, but it also faces an onslaught of new competition, particularly from other niche brands and private labels.
Nom Nom, Ollie, The Farmer’s Dog, and A Pup Above are examples of the growing number of brands competing in the fresh pet food niche. Technavio expects this niche to grow 24% compounded annually from 2021 – 2025, which as even more brands to enter the fresh pet food market.
Perhaps, an even greater threat to Freshpet is the expansion of private label offerings in the pet food market. Large retailers with existing distribution such as Costco (COST), Amazon (AMZN), Kroger (KR) and Chewy (CHWY) all have their own private label pet food brands. These retailers control the amount of physical and digital shelf space they give to manufacturers who compete against them.
The growing presence of private label products has been a large headwind for consumer product firms for decades, and we expect Freshpet will face similar pressure over the long term. Readers can likely see the parallel with Beyond Meat (BYND), which we covered in a prior note you can read here.
A Refrigerator Is Not a Moat
Freshpet may stand out in the pet aisle with its refrigerator, but the novelty of refrigerated pet food will wear off as more companies replicate the concept. Freshpet’s competition could just as easily sell fresh pet food in refrigerators.
Furthermore, refrigerators could be a liability for the company that bills itself as doing good for pets, people, and the planet. Few would argue that Freshpet’s 40,000+ refrigerators across 23,000+ locations are good for the environment. Freshpet tries to offset this environmentally unfriendly distribution method through purchasing renewable energy credits, which makes for good marketing, but in reality, renewable energy credits don’t help much to decarbonize the grid.
Should Freshpet’s environmentally-focused consumers grow more concerned about its high-energy use product, a strong dependance on refrigerators could put its ESG image at risk.
Scale Matters, and the Incumbents Have It
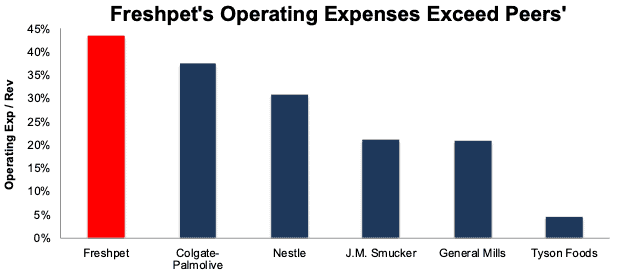
To maintain its growth, Freshpet must spend much more heavily on advertising and building its distribution network than the established competition, whose scale drive much more efficient operations. Per Figure 3, Freshpet’s operating expenses as a percent of revenue, at 44% over the TTM, are much higher than its large competitors.
Figure 3: Freshpet’s Operating Expense as % of Revenue Vs. Competition: TTM
Sources: New Constructs, LLC and company filings
Freshpet’s Profitability Is Dead Last Among Peers
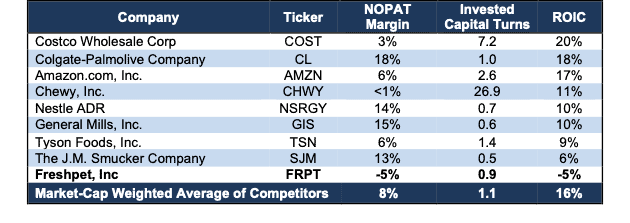
Given its high operating expenses, it comes as no surprise that Freshpet’s -5% return on invested capital (ROIC) and net operating profit after-tax (NOPAT) margin are last among peers. Peers include companies that market their own pet food brands including Costco, Colgate-Palmolive, Amazon, Chewy, Nestle, General Mills, Tyson Foods (TSN), and J.M. Smucker.
Figure 4: Freshpet’s Profitability Vs. Peers: TTM
Sources: New Constructs, LLC and company filings
Feel the Money Burn
Freshpet’s unprofitable growth means that more sales drive increased cash burn. In its 3Q21 earnings call, the firm noted, “it is in our best interest to capture as much of the emerging opportunity as we can…even if we have to absorb some of the short-term costs”.
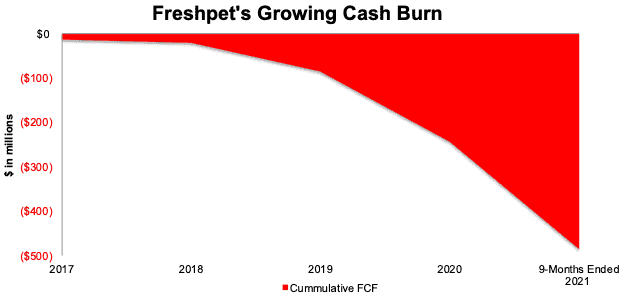
The firm’s free cash flow (FCF) has been negative every year since 2017, which makes us wonder about management’s definition of “short term”. Per Figure 5, the firm’s cash burn is worsening, and since 2017, its cumulative FCF is -$486 million (13% of market cap).
There is no end in sight to copious cash burning as Freshpet expands its manufacturing and distribution capacity and incurs heavy advertising expenses to support its revenue growth.
Figure 5: Freshpet’s Cumulative Free Cash Flow: TTM
Sources: New Constructs, LLC and company filings
Market Tailwinds Are Not Enough
Underpinning Freshpet’s growth story is the long-term growth of pet ownership in the U.S., which accelerated during the COVID-19 pandemic. According to the American Pet Products Association, the number of U.S. households that own a pet has grown from 50.1 million (55% of total) in 1988 to 90.5 million (70% of total), or 2% compounded annually.
U.S. pet expenditures have risen 6% compounded annually over the same time. While strong, the growth in the U.S. pet market is historically nowhere near the revenue growth levels embedded in Freshpet’s valuation, as we’ll show below.
Rising Prices Will Slow Top-Line Growth
Accelerating inflation will be a drag on the premium pet food seller. The firm expects ingredients, labor, and freight inflation of ~17% in 2022 when compared to 4Q20. The firm looks to fully pass these costs on to customers, which makes customer retention and acquisition more difficult.
Passing on all cost increases to customers should help the bottom-line, but it also creates an opportunity for competitors with a price or cost advantage to grow their share of the fresh pet food market.
Premium Prices Limit Growth Potential
Freshpet is a niche player seeking to become a mainstream pet food producer, but its premium-priced products limit its ability to grow beyond its niche, which accounts for just 12% of the total U.S. pet food market. In 2020, the average dog owner spent $442 on pet food and the average cat owner spent $329. According to Consumer Affairs, the midpoint cost to feed a 50-pound dog Freshpet’s pet food is $2,920 per year and the midpoint cost to feed a 10-pound cat Freshpet’s pet food is $913 per year.
If Freshpet was unable generate profits in the past, when consumer’s discretionary income was on the rise, the when will the firm ever generate a profit? Freshpet will likely be hard pressed to drive more customers to spend up to six times the average price of pet food, especially in an inflationary environment.
Don’t Fall for Non-GAAP Results Either
As with most unprofitable firms, Freshpet uses flawed non-GAAP metrics such as adjusted EBITDA, which paints a rosier picture of the firm’s losses. Non-GAAP metrics allow management significant leeway in removing actual costs of the business to present a more optimistic view.
Over the TTM, Fresphet removed, among other items, $22 million (6% of revenue) in non-cash share-based compensation. After all Freshpet’s adjustments, adjusted EBITDA over the TTM is $46 million, compared to GAAP operating losses of -$24 million. Economic earnings, which remove unusual gains/losses and changes to the balance sheet, are even lower, at -$49 million.
Priced to Be Bigger Than J.M. Smucker and General Mills Pet Food Segments
Below we use our reverse discounted cash flow (DCF) model to analyze the future cash flow expectations baked into Freshpet’s stock price. We also provide two additional scenarios to highlight the downside potential in shares if Freshpet’s revenue grows at more reasonable rates.
DCF Scenario 1: to Justify the Current Stock Price.
If we assume Freshpet’s:
- NOPAT margin rises to 8% (equal to peer group market-cap weighted average TTM margin vs. Freshpet’s -5% over the TTM) in 2021 through 2026 and
- revenue grows at a 47% CAGR (vs. 2021 – 2023 consensus estimate CAGR of 32%) through 2026, then
the stock is worth $93/share today – equal to the current stock price. In this scenario, Freshpet generates $3.2 billion in revenue in 2026 or equal to Colgate-Palmolive’s TTM pet food sales, 1.1x J.M. Smucker’s TTM pet food sales, and 1.6x General Mills’ TTM pet food sales. Per Figure 6, at $3.2 billion, Freshpet’s share of the fresh pet food market in 2026 would equal 19%, up from 7% in 2020.
Figure 6: Freshpet’s 2020 Market Share Vs. 2026[1] Implied Market Share
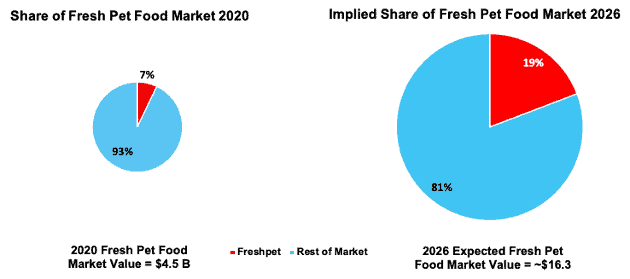
Sources: New Constructs, LLC, company filings, and Technavio
Keep in mind, the number of companies that grow revenue by 20%+ compounded annually for such a long period are unbelievably rare, making the expectations in Freshpet’s share price outright unrealistic.
DCF Scenario 2: Shares are Worth $36 at Consensus Growth
We perform a second DCF scenario to highlight the downside risk to owning Freshpet should it grow at consensus revenue estimates. If we assume Freshpet’s:
- NOPAT margin rises to 8% in 2021 through 2026,
- revenue grows at a 32% CAGR (equal to 2021 – 2023 consensus estimate CAGR) from 2021 – 2023, and
- revenue grows 30% compounded annually from 2024 – 2026, then
the stock is worth $45/share today – or 52% below the current stock price. In this scenario, Freshpet’s ROIC in 2026 is 35%, compared to -5% TTM, and nearly double the TTM ROIC of Costco, the most profitable firm from Figure 4.
DCF Scenario 3: FRPT Has 66%+ Downside
We review a final DCF scenario to evaluate the downside risk should Freshpet grow revenue at the consensus expectations for market growth. If we assume Freshpet’s:
- NOPAT margin rises to 8% in 2021 through 2026 and
- revenue grows at a 24% CAGR (equal to fresh pet food market forecast) from 2021 – 2026, then
the stock is worth just $32/share today – a 66% downside to the current stock price. In this scenario, FRPT still achieves a 25% ROIC in 2026, which is higher than the ROIC of all of peers.
Figure 7 compares Freshpet’s historical revenue to its implied revenue in each of the above DCF scenarios. We also include the 2020 pet food sales from peers JM Smucker, Colgate-Palmolive, and General Mills.
Figure 7: Freshpet’s Historical and Implied Revenue: DCF Valuation Scenarios
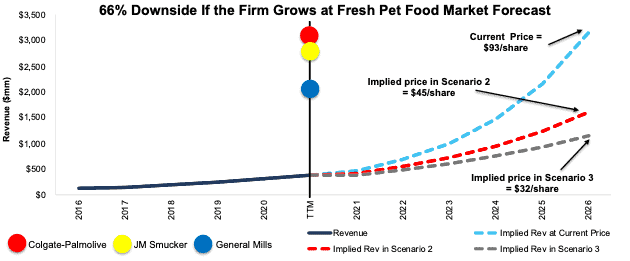
Sources: New Constructs, LLC and company filings
Each of the above scenarios also assumes Freshpet grows revenue, NOPAT, and FCF without increasing working capital or fixed assets. This assumption is highly unlikely but allows us to create best-case scenarios that demonstrate the expectations embedded in the current valuation. For reference, Freshpet’s TTM invested capital is five times its 2016 level. Additionally, the firm estimates its current manufacturing operations can generate only ~$700 million in sales and is actively investing in expanding its capacity. If we assume Freshpet’s invested capital increases at a similar historical rate in DCF scenarios 2-3 above, the downside risk is even larger.
Acquisition Would Be Unwise
Often the largest risk to any bear thesis is what we call “stupid money risk”, which means an acquirer comes in and buys Freshpet at the current, or higher, share price despite the stock being overvalued. Given our analysis above, the only plausible justification for FRPT trading at such a high price is the expectation that another firm will buy it, especially given General Mills’ ~$8 billion acquisition of Blue Buffalo in 2018 and $1.2 billion purchase of Tyson Foods’ pet treats portfolio in 2021.
However, we think if General Mills were looking to expand into the fresh pet food market through an acquisition of Freshpet, it would need a significant discount from current prices to even consider. For instance, at ~$8 billion, Blue Buffalo was valued at a 6.3 price-to-revenue ratio. If we assume a similar ratio in an acquisition of Freshpet, the firm would be worth ~$2.5 billion, or 38% below its current market cap.
General Mills’ valuation of Tyson Food’s pet treat portfolio was even lower at a price-to-revenue ratio of 5.0. If we assume a similar ratio in an acquisition of Freshpet, the firm would be worth just $2.0 billion, or 50% below its current market cap.
Of course, stranger things have happened than firms being acquired at unnecessarily high premiums, so it’s certainly not out of the question. However, we think it’s important to quantify how high the acquisition hopes priced into the stock are.
Walking Through the Acquisition Math
First, investors need to know that Freshpet has liabilities that make it more expensive than the accounting numbers would initially suggest.
- $80 million in outstanding employee stock options (2% of market cap)
- $7 million in total debt (<1% of market cap)
After adjusting for all liabilities, we can model multiple purchase price scenarios. For this analysis, we chose General Mills as a potential acquirer of Freshpet, given its recent pet food buying spree, but analysts can use just about any company to do the same analysis. The key variables are the weighted average cost of capital (WACC) and ROIC for assessing value creation at different hurdle rates.
There are limits on how much General Mills should pay for Freshpet to earn a proper return, given the NOPAT or free cash flows being acquired. Figures 8 and 9 show what we think General Mills should pay for Freshpet to ensure it does not destroy shareholder value. Even in the most optimistic of acquisition scenarios, Freshpet is worth less than its current share price.
Each implied price is based on a ‘goal ROIC’ assuming different levels of revenue growth. In Scenario 1, we use 34% revenue growth in Year 1, 32% in Year 2, and 30% in Year 3, which equal consensus estimates. In the first scenario, we extend the 2023 consensus estimate of 30% to years three through five. In the second scenario, we use 40% in years one through five. We use the higher estimates in scenario two to illustrate a best-case scenario that assumes Freshpet grows revenue faster while being integrated within General Mills’ existing business.
We optimistically assume Freshpet achieves a 6% NOPAT margin, which is above its TTM margin of -5%, and equal to Tyson’s TTM NOPAT margin. We also optimistically assume that General Mills can grow Freshpet’s revenue and NOPAT without spending any working capital or fixed assets beyond the original purchase price, which is highly unlikely given Freshpet’s capacity constraints.
Figure 8: Implied Acquisition Prices for Value-Neutral Deal – Scenario 1
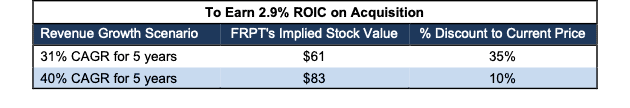
Sources: New Constructs, LLC and company filings
Figure 8 shows the implied values for Freshpet assuming General Mills wants to achieve an ROIC on the acquisition that equals its WACC of 2.9%. This scenario represents the minimum level of performance required to avoid value destruction. Even if Freshpet can grow revenue by 40% compounded annually for five years and achieve a 6% NOPAT margin, the firm is worth just $83/share. It’s worth noting that any deal that only achieves a 2.9% ROIC would not be accretive, as the return on the deal would equal General Mills’ WACC.
Figure 9: Implied Acquisition Prices to Create Value – Scenario 2
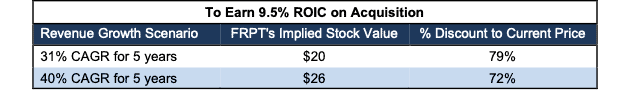
Sources: New Constructs, LLC and company filings
Figure 9 shows the implied values for Freshpet assuming General Mills wants to achieve an ROIC on the acquisition that equals 9.5%, its current ROIC. Acquisitions completed at these prices would be accretive to General Mills’ shareholders. In this best-case growth scenario, the implied value is far below Freshpet’s current price. Without significant increases over the margin and/or revenue growth assumed in this scenario, an acquisition of Freshpet at its current price destroys significant shareholder value.
Earnings Miss and Expanding Losses Could Send Shares Lower
Freshpet has missed earnings in 10 of the past 12 quarters and doing so again could cause shares to tumble even further.
While the firm expects to fully offset the rise in its supply costs with price increases, should some of the firm’s customers respond by switching to more affordable alternatives, the firm could miss revenue growth expectations, which have been supporting its elevated stock price.
Furthermore, the introduction of more direct competition in the fresh pet food market from large incumbents with more established manufacturing and distribution networks could slow the firm’s rapid growth and cause investors to send the stock price to more reasonable levels, a phenomenon we’ve seen with many growth names so far in 2022.
What Noise Traders Miss With FRPT
These days, fewer investors pay attention to fundamentals and the red flags buried in financial filings. Instead, due to the proliferation of noise traders, the focus tends toward technical trading trends while high-quality fundamental research is overlooked. Here’s a quick summary for noise traders when analyzing FRPT:
- industry-high operating costs
- large cash-burning operation
- lack of moat in crowded industry, with large incumbents looking to provide more competition
- profitability already well below competition
- valuation implies the firm will be the larger than J.M. Smucker’s, Colgate-Palmolive’s, and General Mills’ pet food businesses
Executive’s Get Compensated While Destroying Shareholder Value
Freshpet ties 50% of performance-based options to a target Adjusted EBITDA. Tying executive compensation to Adjusted EBITDA is problematic given how misleading the metric can be. Over the TTM, Freshpet’s Adjusted EBITDA of $46 million is much higher than its economic earnings of -$49 million.
Freshpet should link executive compensation with improving ROIC, which is directly correlated with creating shareholder value, so shareholders’ interests are properly aligned with executives’ interests.
Don’t Buy What Insiders are Selling
Over the past 12 months, insiders have purchased 19.7 million shares and sold 101.9 million shares for a net effect of 82.1 million shares sold. If insiders are selling, why shouldn’t you?
There are currently 2.8 million shares sold short, which equates to 6% of shares outstanding and just under five days to cover. The number of shares sold short has increased by 8% since last month. The increase in shares sold short indicates more investors realize just how unrealistic the expectations baked into the current stock price really are.
Critical Details Found in Financial Filings by Our Robo-Analyst Technology
As investors focus more on fundamental research, research automation technology is needed to analyze all the critical financial details in financial filings as shown in the Harvard Business School and MIT Sloan paper, "Core Earnings: New Data and Evidence”.
Below are specifics on the adjustments we make based on Robo-Analyst findings in Freshpet’s 10-Qs and 10-K:
Income Statement: we made $5 million of adjustments, with a net effect of removing $4 million in non-operating expenses (1% of revenue). You can see all the adjustments made to Freshpet’s income statement here.
Balance Sheet: we made $134 million of adjustments to calculate invested capital with a net decrease of $127 million. One of the most notable adjustments was $3 million in asset write-downs. This adjustment represented 1% of reported net assets. You can see all the adjustments made to Freshpet’s balance sheet here.
Valuation: we made $238 million of adjustments with a net effect of increasing shareholder value by $64 million. The largest adjustment to shareholder value was $151 million in excess cash. This adjustment represents 4% of Freshpet’s market cap. See all adjustments to Freshpet’s valuation here.
Unattractive Funds That Hold FRPT
The following funds receive our Unattractive-or-worse rating and allocate significantly to FRPT:
- LKCM Small Mid Cap Equity Funds (LKSMX) – 2.5% allocation and Unattractive rating
- Fisher Investments Institutional U.S. Small Cap Equity Fund (IUSCX) – 2.2% allocation and Unattractive rating
This article originally published on February 2, 2022.
Disclosure: David Trainer, Kyle Guske II, and Matt Shuler receive no compensation to write about any specific stock, style, or theme.
Follow us on Twitter, Facebook, LinkedIn, and StockTwits for real-time alerts on all our research.
[1] We assume the fresh pet market grows 24% year-over-year in 2026, the same CAGR in Technavio’s 2021 – 2025 forecast.