
We’re excited to announce enhancements to the Decision page of our Company Valuation Models.
Institutional members can now compare, in a single chart, the past performance of key metrics with the future performance implied by the stock price. You can see examples of these charts in the valuation section of our Long Idea and Danger Zone reports, e.g. see Figure 11 in this report. These charts help investors visualize the differences between past performance and future expectations baked into a stock for the multiple forecast scenarios clients can program into our reverse DCF models.
Clients can chart past vs future performance for these metrics:
- Revenue
- Net operating profit before-tax
- Net operating profit after-tax (NOPAT)
- Free cash flow (FCF)
- Return on invested capital (ROIC)
- NOPAT margins
- Average invested capital turns
- Economic earnings
- Average invested capital
- Invested capital
Figure 1 shows the new Decision page charting capabilities.
Figure 1: Historical and Implied Future Performance Chart – Decision Page
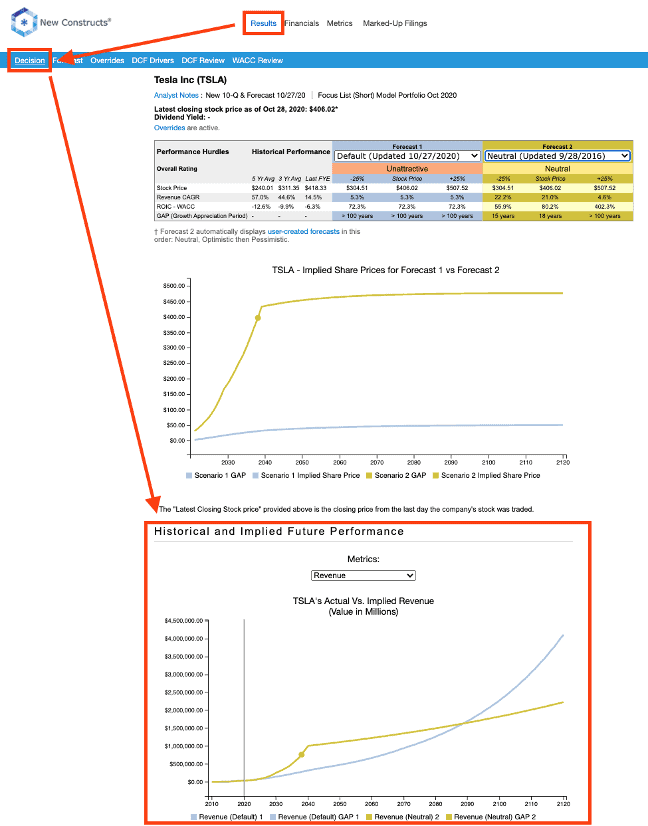
Sources: New Constructs, LLC and company filings.
To create your own Historical and Implied Future Performance chart, first create a custom forecast scenario on the Forecast page. Then, select the Forecast scenario you’d like to view in the chart from the Forecast scenario dropdown menu on the Decision page, per Figure 2.
Figure 2: DCF Forecast Visualized: Select Your Custom Forecast
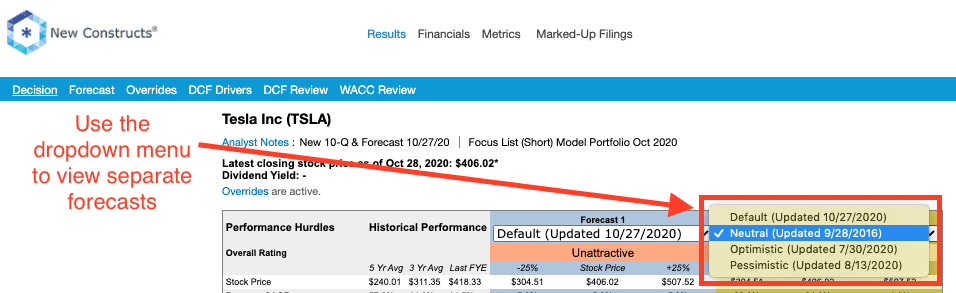
Sources: New Constructs, LLC and company filings.
Utilize the Metrics dropdown menu to view different metrics from the chosen forecast scenario. Figure 3 compares the implied future revenue from the Neutral and Default scenarios to Tesla’s (TSLA) historical revenue.
Figure 3: DCF Forecast Visualized: Revenue Historical and Implied Future Performance Chart
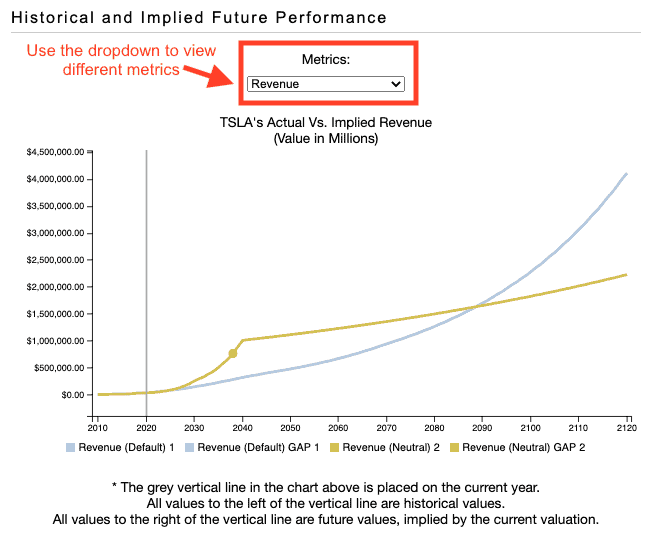
Sources: New Constructs, LLC and company filings.
Figure 4 compares the implied future NOPAT from the Neutral and Default scenarios to Tesla’s historical NOPAT.
Note the dot on the line indicates the market implied growth appreciation period (GAP), or the DCF forecast year that generates a price closest to the current price.
Figure 4: DCF Forecast Visualized: NOPAT Historical and Implied Future Performance Chart
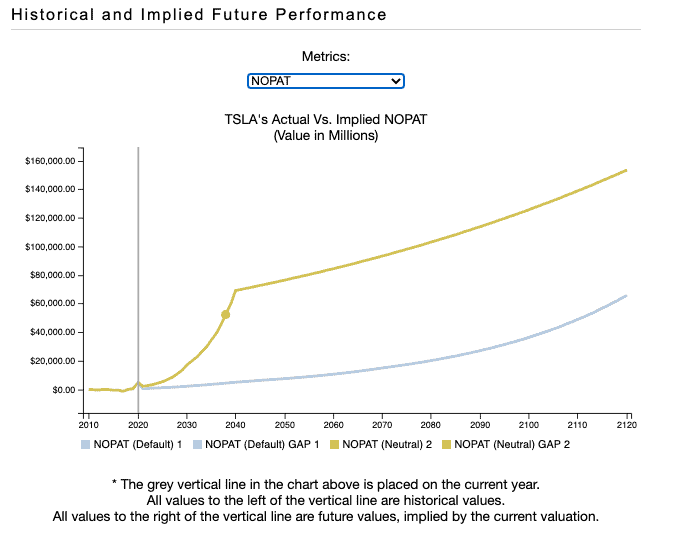
Sources: New Constructs, LLC and company filings.
Please contact us at support@newconstructs.com if you have any questions.
This article originally published on October 30, 2020.
Disclosure: David Trainer, Kyle Guske II, and Matt Shuler receive no compensation to write about any specific stock, style, or theme.
Follow us on Twitter, Facebook, LinkedIn, and StockTwits for real-time alerts on all our research.