Six new stocks make our Safest Dividend Yield Model Portfolio this month, which was made available to members on September 22, 2017.
Recap from August’s Picks
Our Safest Dividend Yield Model Portfolio underperformed the S&P 500 last month. The Model Portfolio rose 1.1% on a price return basis and 1.8% on a total return basis. The S&P 500 rose 2.5% on a price return basis and 3.0% on a total return basis. The best performing stocks in the portfolio were large cap stock LyondellBasell Industries (LYB), which was up 7%, and small cap stock, DSW Inc. (DSW), which was up 6%. Overall, seven out of the 20 Safest Dividend Yield stocks outperformed the S&P 500 in September and 13 had positive returns.
Since inception, this Model Portfolio is up 10% on a price return basis (S&P +16%) and 15% on a total return basis (S&P +18%).
This Model Portfolio highlights the value of our Robo-Analyst technology, which scales our forensic accounting expertise (featured in Barron’s) across thousands of stocks.
This Model Portfolio only includes stocks that earn an Attractive or Very Attractive rating, have positive free cash flow and economic earnings, and offer a dividend yield greater than 3%. Companies with strong free cash flow provide higher quality and safer dividend yields because we know they have the cash to support the dividend. We think this portfolio provides a uniquely well-screened group of stocks that can help clients outperform.
New Stock Feature for September: Target Corporation (TGT: $59/share)
Target Corporation (TGT) is one of the additions to our Safest Dividend Yield Model Portfolio in September. We’ve previously featured TGT in an analysis vs. Wal-Mart (WMT) and as a Long Idea in April 2015.
Over the past 15 years, TGT has grown revenue by 4% compounded annually and after-tax profit (NOPAT) by 5% compounded annually. Over the last five years, revenues have been flat due to increased competition within the retail sector, particularly from e-commerce. TGT has still managed to grow NOPAT by 1% compounded annually over the past five years by slightly improving NOPAT margins. TGT’s 5% NOPAT margin over the trailing twelve months is consistent with the 15-year average. Return on invested capital (ROIC) has also been impressively consistent. Since 1998, TGT has averaged a 10% ROIC and currently earns a 10% TTM ROIC. Add in the 4.2% dividend yield and its clear why TGT earned a spot on this month’s Model Portfolio.
Figure 1: TGT’s Growing Profits Since 2003
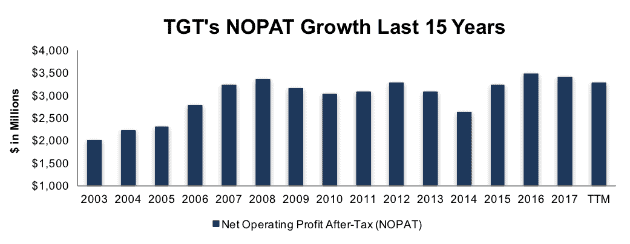
Sources: New Constructs, LLC and company filings
Free Cash Flow Supports Dividend Growth
TGT has paid quarterly dividends every year since its IPO in 1967. TGT increased its quarterly dividend from $0.43 to $0.62 over the past five years, or 10% compounded annually. Dividend growth has been made possible by TGT’s strong free cash flow. Per figure 2, TGT has generated cumulative FCF of $21 billion (66% of market cap) and paid out cumulative dividends of $5.8 billion since 2013.
Companies with strong free cash flow provide higher quality dividend yields because we know the firm has the cash to support its dividend. On the flip side, dividends from companies with low or negative free cash flow cannot be trusted as much because the company may not be able to sustain paying dividends.
Figure 2: Target’s FCF vs. Dividends Since 2013
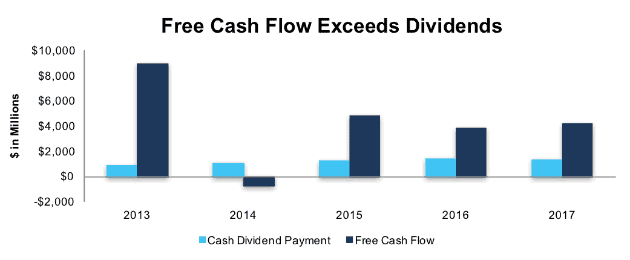
Sources: New Constructs, LLC and company filings
TGT Remains Undervalued
TGT is down 18% year-to-date, while the S&P 500 is up 12%. This price depreciation amidst solid fundamentals and significant cash flow generation provides an attractive buying opportunity. At its current price of $59/share, TGT has a price-to-economic book value (PEBV) ratio of 0.5. This ratio means the market expects TGT’s NOPAT to decline 50% from current levels. This expectation seems overly pessimistic for a firm with a nearly two-decade track record of NOPAT growth.
If TGT can maintain 2017 NOPAT margins (5%) and grow NOPAT by just 1% compounded annually for the next five years, the stock is worth $125/share today – a 118% upside. Significant upside potential coupled with TGT’s 4.2% dividend yield provides investors with an attractive risk/reward opportunity.
Auditable Impact of Footnotes & Forensic Accounting Adjustments
Our Robo-Analyst technology enables us to perform forensic accounting with scale and provide the research needed to fulfill fiduciary duties. In order to derive the true recurring cash flows, an accurate invested capital, and a real shareholder value, we made the following adjustments to Target Corporation’s 2017 10-K:
Income Statement: we made $2 billion of adjustments with a net effect of removing $668 million in non-operating expenses (1% of revenue). We removed $1.3 billion related to non-operating expenses and $682 million related to non-operating income. See all adjustments made to TGT’s income statement here.
Balance Sheet: we made $9 billion of adjustments to calculate invested capital with a net increase of $8.9 billion. The most notable adjustment was $3.8 billion (16% of reported net assets) related to asset write-downs. See all adjustments to TGT’s balance sheet here.
Valuation: we made $15.5 billion of adjustments with a net effect of decreasing shareholder value by $15.4 billion. The most notable adjustment to shareholder value was $$14.6 billion in total debt, which includes $2.3 billion in off-balance sheet operating leases. This lease adjustment represents 7% of TGT’s market value. Despite the decrease in shareholder value, TGT remains undervalued.
This article originally published on September 28, 2017.
Disclosure: David Trainer, Kyle Guske II, and Kenneth James receive no compensation to write about any specific stock, style, or theme.
Follow us on Twitter, Facebook, LinkedIn, and StockTwits for real-time alerts on all our research.