
The choice between active and passive management is often seen as a simple binary for investors: you pay more for active management with the opportunity for outperformance or you pay less for passive management and content yourself with meeting the benchmark.
However, a new fee structure gives investors the potential to benefit from the best of both worlds. Several new funds have launched over the past year with a “fulcrum fee” structure that adjusts automatically with performance. If the fund lags or meets its benchmark, investors are charged index-level fees; if the fund outperforms, the fees rise proportionally.
Leveraging our Robo-Analyst technology[1], which analyzes the holdings of all 7,953 ETFs and mutual funds under coverage, we found a mutual fund that offers this attractive fee structure and allocates to high-quality stocks based on analysis of their return on invested capital (ROIC)[2]. This mutual fund, AllianceBernstein FlexFee Large Cap Growth Portfolio (FFLYX), is this week’s Long Idea.
Holdings Analysis Reveals Quality Asset Allocation
FFLYX chief investment officer Frank Caruso has repeatedly emphasized the importance of ROIC. In a blog post last year he wrote:
“Our yardsticks are return on invested capital (ROIC) and return on assets (ROA), which tell us whether a company is investing intelligently to grow profits. Stocks of firms that generate an ROIC above a certain threshold, the so-called cost of capital, tend to outperform over the long term.”
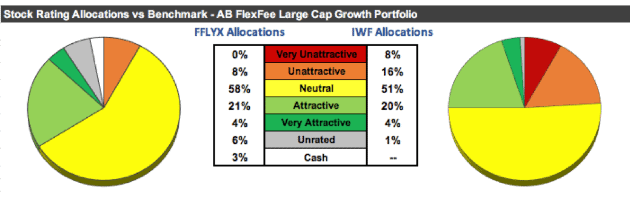
This focus on ROIC helps FFLYX do a better job of picking high quality holdings and avoiding risky stocks compared to its peers. Figure 1 shows that FFLYX allocates a higher percentage of its assets to Attractive-or-better stocks and a lower percentage to Unattractive-or-worse stocks than its benchmark, the iShares Russell 1000 Growth ETF (IWF).
Figure 1: FFLYX Asset Allocation Compared to IWF
Sources: New Constructs, LLC and company filings
Per Figure 1, FFLYX does only a slightly better job of identifying Attractive-or-better stocks than its benchmark, allocating 25% vs. 24% for IWF. The fund’s main advantage comes from its ability to avoid potential blowups. Just 8% of its assets are allocated to Unattractive-or-worse holdings compared to 24% for IWF.
Managers Actually Find High ROIC Stocks
Anyone can say they focus on ROIC, but our analysis of FFLYX’s holdings shows that management puts their money where their mouth is. The fund’s holdings have an average ROIC of 30%, compared to 27% for IWF and just 18% for the S&P 500 ETF (SPY).
In addition, FFLYX allocates to companies that prioritize ROIC. The fund’s fourth-largest holding, Home Depot (HD), is in our Exec Comp Aligned With ROIC Model Portfolio due to the fact that it ties bonuses to achieving ROIC targets.
ROIC Focus Protects Against Risk
FFLYX’s focus on ROIC serves as a counterargument against one of the common criticisms of fulcrum fees: that they incentive excessive risk-taking by fund managers. From a recent Barron’s article on the topic:
“They (fulcrum fees) can encourage more risk-taking by fund managers seeking higher fees for outperforming their benchmarks. Since historically the market has gone up a lot more than it’s gone down, simply applying leverage to a market-tracking portfolio could ensure big payouts even if there is significant downside risk.”
The concern here is reasonable, but our analysis of FFLYX’s holdings shows that concern is not warranted in this case. Quite the contrary, the fund does a good job of avoiding the highest-risk stocks.
Another article from Caruso sheds more light on how the fund managers use ROIC as a way to avoid excessive risk. His article in WealthManagement.com last year, entitled “Under Armour and the Earnings Fallacy”, explained how Under Armour’s (UAA) rising earnings masked its declining ROIC and ROA. He wrote that earnings growth only creates value if a company earns an ROIC greater than its cost of capital (WACC).
We agree with Caruso on the importance of earning an ROIC greater than WACC (and on his specific concerns with Under Armour). By starting with ROIC, Caruso and the rest of the FFLYX management team avoid investing in risky stocks with misleading earnings growth.
Investor-Friendly Fees
FFLYX’s fee structure is designed to give investors index-like costs if it underperforms its benchmark while maintaining reasonable fees for outperformance. Depending on the level of performance, FFLYX’s expense ratio ranges from a minimum of 0.10% to a maximum of 1.10%. Based on our total annual cost analysis, which assumes a three-year holding period, that equates to a range of 0.11% to 1.22% in all-in annual costs. As Figure 2 shows, even the high end of that range is roughly at the median of all 712 Large Cap Growth funds we cover.
Figure 2: FFLYX Total Annual Costs by Outperformance

Sources: New Constructs, LLC and company filings
Even if FFLYX outperforms the market by 280 basis points (2.8%) or more, investors only have to pay roughly average fees. If the fund meets or lags its benchmark, investors will pay fees that are lower than all but nine funds in the Large Cap Growth style.
High ROIC Holdings Present Significant Upside
We emphasized FFLYX’s ability to avoid risky stocks above, but the fund also has several major holdings that present investors with significant upside.
Alphabet (GOOG) is the fund’s top holding and accounts for 8% of its portfolio. We recommended Alphabet to investors in our article “Now’s the Time to Buy This Discounted Tech Giant,” and even after a 15% gain the stock remains in our Focus List – Long Model Portfolio.
GOOG makes perfect sense as the largest holding for FFLYX, a growth fund that emphasizes ROIC. As we wrote in our article, the company has grown revenue by double digits while maintaining an ROIC above 25% for eight consecutive years dating back to 2010. Only two other companies can match that track record, and both face looming patent cliffs.
GOOG’s impressive growth and profitability give the stock significant upside despite its above-average valuation. If the company can grow after-tax operating profit (NOPAT) by 14% compounded annually for ten years (below its 20% NOPAT growth rate over the past ten years), the stock is worth ~$1520 today, 21% above the current share price. See the math behind this dynamic DCF scenario.
Past Performance Backs up Holdings Quality
We don’t take past performance into account for our fund ratings, as past performance is not predictive of future results. However, we know that many investors and advisors will only consider funds that earn a five-star rating from Morningstar.
We have good news for those investors. While FFLYX is only recently launched and doesn’t yet have a star rating, its strategy mirrors that of the AB Large Cap Growth Fund (APGAX), which does earn a five-star rating from Morningstar.
Over the past five years, $10,000 invested in APGAX would have grown to $21,964, 16% above the $18,977 value of that same investment in the benchmark. The success of this strategy shows that the fund can deliver market-beating returns during a bull market, while its holdings suggest it can protect investors during a bear market.
The combination of a strong track record, sound investment strategy, high-quality holdings, and low fees makes it hard to argue against FFLYX as a good investment. We think this new fund should catch on quick with investors.
This article originally published on August 8, 2018.
Disclosure: David Trainer, Kyle Guske II, and Sam McBride receive no compensation to write about any specific stock, style, or theme.
Follow us on Twitter, Facebook, LinkedIn, and StockTwits for real-time alerts on all our research.
[1] Harvard Business School features the powerful impact of our research automation technology in the case New Constructs: Disrupting Fundamental Analysis with Robo-Analysts.
[2] Ernst & Young’s recent white paper “Getting ROIC Right” proves the importance of an accurate calculation of ROIC.
Click here to download a PDF of this report.