Our latest featured stock has several unusual restructuring charges hidden away in its annual filing. Last week, we analyzed 406 10-Ks and 10-Qs.
Analyst Jacob McDonough found a large unusual item buried in the footnotes of GlaxoSmithKline’s (GSK) 2019 20-F.
On page 186, GSK discloses $1.4 billion in restructuring charges hidden in GAAP net income. GSK bundles these charges into income statement line items as follows:
- $863 million in Cost of sales
- $436 million in Selling, general and administration
- $150 million in Research and development
- $1 in million in other operating expenses
In addition to the restructuring charges, GSK disclosed $453 million in transaction-related expenses. These expenses were partially offset by $449 million in profit on the sale of intangible assets and $264 million in profit on the sale of businesses.
In total, we removed $1.5 billion in net earnings distortion to calculate GSK’s 2019 adjusted core earnings[1] of $7.6 billion, which is much higher than its GAAP net income of $6.1 billion.
GSK is no stranger to large amounts of earnings distortion. In its 2015 20-F, GSK disclosed over $16 billion in unusual gains related to restructuring, including a gain of $14.3 billion from the disposal of businesses and assets which included the sale of its Oncology business to Novartis AG (NVS). This earnings distortion means GAAP net income in 2015 was overstated by $6.5 billion.
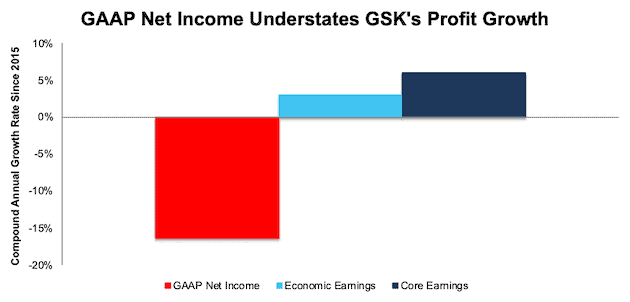
Artificially high GAAP net income in 2015 gives investors a misleading picture of GSK’s business over the last five years. GAAP net income has fallen by 16% compounded annually since 2015 but core earnings and economic earnings – which reveal a more complete picture of profitability by including adjustments to both the income statement and the balance sheet – are trending higher. Since 2015, GSK has grown core earnings by 6% compounded annually and economic earnings by 3% compounded annually.
Figure 1: GSK’s Core Earnings and Economic Earnings Are Growing
Sources: New Constructs, LLC and company filings.
GSK’s understated earnings in 2019 earn the stock our “Beat” Earnings Distortion Score (as featured on CNBC Squawk Box), which means it is likely to beat consensus expectations.
Other Critical Details on GSK Found by Our Robo-Analyst Technology
Balance Sheet: we made $52.2 billion of adjustments to calculate invested capital with a net decrease of $8.8 billion. Our largest adjustment was $12.8 billion related to midyear acquisitions (18% of reported net assets). See all adjustments made to GSK’s balance sheet here.
Valuation: we made $68.0 billion of adjustments with a net effect of decreasing shareholder value by $50.1 billion. Apart from total debt, the largest adjustment to shareholder value was $9.1 billion in the fair value of minority interests. This adjustment is 4% of GSK’s market value. See all adjustments to GSK’s valuation here.
The Power of the Robo-Analyst
We analyze 406 10-K and 10-Q filings last week, from which our Robo-Analyst[2] technology collected 39,443 data points. Our analyst team made 6,509 forensic accounting adjustments with a dollar value of $1.6 trillion. The adjustments were applied as follows:
- 2,464 income statement adjustments with a total value of $91.9 billion
- 2,833 balance sheet adjustments with a total value of $727 billion
- 1,345 valuation adjustments with a total value of $814 billion
Figure 2: Filing Season Diligence for Week of March 8 – March 15

Sources: New Constructs, LLC and company filings.
Every year in this six-week stretch from mid-February through the end of March, we parse and analyze roughly 2,000 10-Ks to update our models for companies with 12/31 and 1/31 fiscal year ends. This effort is made possible by the combination of expertly trained human analysts with our “Robo-Analyst.” Featured by Bloomberg and Harvard Business School in “Disrupting Fundamental Analysis with Robo-Analysts”, our research automation technology uses machine learning and natural language processing to automate and improve financial modeling.
No Substitute for Diligence
Our technology enables us to deliver diligence on fundamentals at a previously impossible scale. We believe this research is necessary to uncover the true profitability of a firm and make sound investment decisions. “Core Earnings: New Data and Evidence,” a recent paper from professors at Harvard Business School and MIT Sloan, shows how our adjustments create a measure of core earnings that is more predictive of future earnings than comparable metrics from Compustat and IBES.
Only by reading through the footnotes and making adjustments to reverse accounting distortions can investors and advisors alike get beyond the noise and get the truth about earnings and valuation.
This article originally published on March 17, 2020.
Disclosure: David Trainer, Jacob McDonough, Kyle Guske II, and Matt Shuler receive no compensation to write about any specific stock, sector, style, or theme.
Follow us on Twitter (#filingseasonfinds), Facebook, LinkedIn, and StockTwits for real-time alerts on all our research.
[1] Our Core earnings are a superior measure of profits, as demonstrated in In Core Earnings: New Data & Evidence a paper by professors at Harvard Business School (HBS) & MIT Sloan. The paper empirically shows that our data is superior to IBES “Street Earnings”, owned by Blackstone (BX) and Thomson Reuters (TRI), and “Income Before Special Items” from Compustat, owned by S&P Global (SPGI).
[2] Harvard Business School features the powerful impact of our research automation technology in the case New Constructs: Disrupting Fundamental Analysis with Robo-Analysts.