
The NBL position was closed due to acquisition on October 5, 2020. Details in the Position Update report here.
Check out this week’s Danger Zone interview with Chuck Jaffe of Money Life.
As prices fall, many dividend yields rise and look more attractive. However, a dividend is only as reliable as the firm’s cash flows. Given that cash flows are at higher risk these days, firms who struggled to pay dividends before the crisis may be forced to cut their dividends while GDP suffers. Investors need to do diligence on fundamentals to assess the reliability of dividend yields.
Our Robo-Analyst[1] identifies firms with seemingly attractive dividend yields, but without the cash flows to sustain them. These firms are most at risk of cutting dividends in the future, especially as economic conditions deteriorate and resources are stretched thinner. Risky dividend stocks are in the Danger Zone this week.
Not All Dividend Yields Are Created Equal
High yielding dividend stocks hold great appeal for some investors. But, that appeal disappears quickly if the firm doesn’t generate the free cash flow needed to pay its promised dividend.
Here are the criteria we used to identify the riskiest dividend yields:
- Dividend yield greater than 4%
- Negative free cash flow (FCF) yield over the trailing twelve month (TTM) period
- Cumulative five-year FCF less than cumulative five-year dividend payments
- Net debt greater than 25% of market cap
- A Neutral-or-worse Risk/Reward rating
We then ranked these firms based on the deficit between FCF and dividend payments over the last five years. We categorize Utilities firms separately due to the unique nature of the Utilities industry.
Figure 1 includes all firms with a FCF minus dividends deficit greater than $2 billion.
Figure 1: At Risk Dividend Yields – FCF vs. Dividend Deficit Greater Than $2 Billion
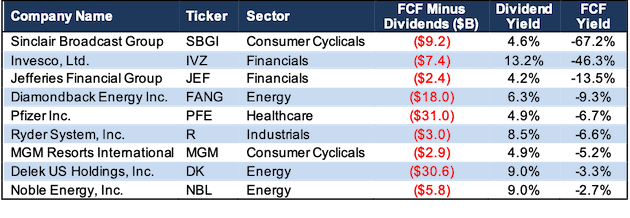
Excludes Real Estate Investment Trusts (REITs) and Utilities
Sources: New Constructs, LLC and company filings.
The firms in Figure 1 vary by industry, but each has paid out significantly more in dividends than they have generated in FCF over the past five years. In a slowing or even contracting economy, with already negative FCF, the firms may need all the cash they can get their hands on to keep the business above water and dividends will have to be cut.
Dividends from Energy companies are particularly risky given the recent crash in oil prices. As oil and gas firms cut capital spending and delay or close down projects, those with already low profitability are at greater risk of cutting dividends to preserve resources. Some firms, such as Occidental Petroleum (OXY) have already significantly cut dividend payments. Firms in Figure 1, such as Diamondback Energy (FANG), Noble Energy (NBL), and Delek US Holdings (DK) could be next.
Figure 2 includes the firms with a FCF minus dividends deficit of less than $2 billion.
Figure 2: At Risk Dividend Yields – FCF vs. Dividend Deficit Less Than $2 Billion
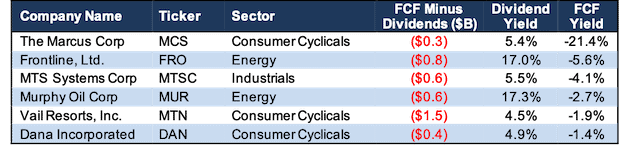
* Excludes Real Estate Investment Trusts (REITs) and Utilities
Sources: New Constructs, LLC and company filings.
Figure 2 contains Consumer Cyclicals and Industrials firms such as Vail Resorts (MTN), Dana Incorporated (DAN), and MTS Systems Corp (MTSC). These firms face diminished demand given the stay-at-home orders issued across the world, record unemployment, and a global economic slowdown. Already negative FCF means a dividend cut to preserve the business as a going concern could be in the near future.
Figure 3 lists the Utilities firms that meet the criteria outlined above. However, we acknowledge that Utilities firms’ dividends may be at less risk because they are regulated entities. Public utilities commissions regulate rates and services of a Utility firm in a region and help ensure steady cash flows to the firm.
Figure 3: At Risk Dividend Yields - Utilities
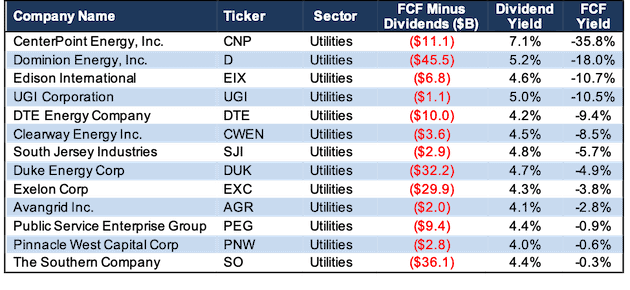
* Excludes Real Estate Investment Trusts (REITs)
Sources: New Constructs, LLC and company filings.
With payout ratios as high as 200%, and even negative ratios, many of the firms in Figures 1-3 are already paying dividends well above their means. See Appendix 1 for more details on payout ratios.
These companies can maintain dividends in the short-term by using debt or drawing down stored cash, but the lack of necessary cash flows coming in may force them to cut the dividend. Below we’ll examine two firms in greater detail.
Noble Energy (NBL) – 9.0% dividend yield at risk
Noble Energy’s 9.0% dividend yield may draw investors’ eye, but they would be wise to turn away. The fundamentals of this business don’t support such a high dividend, and the shock to oil prices and looming economic downturn put the dividend at even more risk.
Profitability Headed Down Before Oil Crash
NBL’s fundamentals and profitability were already trending down before oil prices fell and the COVID-19 pandemic significantly altered the global economy. NBL’s net operating profit after-tax (NOPAT) margin fell from 14% in 2018 to 1% in 2019. NBL’s invested capital turns, a measure of capital efficiency, fell slightly from 0.19 to 0.16 over the same time. The combination of falling margin and capital turns drove NBL’s already low ROIC from 3% in 2018 to a bottom-quintile 0% in 2019.
Burning Cash in Recent Years
NBL has generated negative free cash flow in nine of the past ten years and burned a cumulative -$4.7 billion since 2015. However, the firm has paid out nearly $1.1 billion in dividends over the same time. Figure 4 plots the $5.8 billion deficit between free cash flow and dividends since 2015.
The firm’s FCF yield of -3%, which is well below the 7% average of Energy sector firms, further illustrates the firm’s cash burn. With oil prices falling, cash flow could fall even more in 2020, which would put further strain on the dividend payments.
Figure 4: NBL’s FCF Vs. Dividends Since 2015
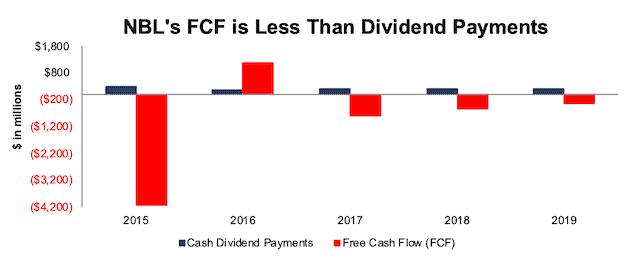
Sources: New Constructs, LLC and company filings
Not surprisingly, with negative FCF, NBL is forced to dilute investors and sell debt and equity to pay dividends. The firm’s shares outstanding are 11% higher than 2016 while net debt is up 19% over the same time. In 2019, NBL’s net debt of $7 billion represents 274% of its current market cap. In addition, NBL has over $244 million in operating leases (10% of market cap) that further increase its debt load. Should access to capital dry up, NBL could be forced to cut its dividend.
The Marcus Corp (MCS) – 5.4% dividend yield at risk
While MCS’s 5.4% dividend yield may look attractive on the surface, a deeper dive reveals this dividend could be at risk.
As an operator of over 90 movie theater complexes and 20 hotels and resorts, The Marcus Corp’s business is severely disrupted by the COVID-19 pandemic. MCS has already announced the closure of its theaters and some of its hotels/resorts. A dividend cut, similar to peer AMC Entertainment (AMC), could be next.
Profitability Already Trending Down
MCS’s profitably was headed in the wrong direction even before the onset of the pandemic. In 2019, MCS’s operational efficiency declined to its lowest level since 2015. Net operating profit after-tax (NOPAT) margin fell from 9.2% in 2018 to 7.6% in 2019. This NOPAT margin is also the lowest among peers, AMC Entertainment Holdings (AMC) and Cinemark Holdings (CNK). MCS’s invested capital turns, a measure of capital efficiency, fell from 0.71 to 0.70. The combination of falling margin and capital turns drove MCS’s ROIC from 7% in 2018 to 5% in 2019.
Cash Burning Business
MCS has generated negative free cash flow in three of the past four years while burning a cumulative -$205 million since 2015. However, the firm has paid out over $67 million in dividends over the same time. Figure 5 plots the $272 million deficit between free cash flow and dividends since 2015. MCS’s current FCF yield is -22%, which is well below the Consumer Cyclicals sector average of 1%, and highlights MCS’s significant cash burn.
Figure 5: MCS’s FCF vs. Dividends Since 2015
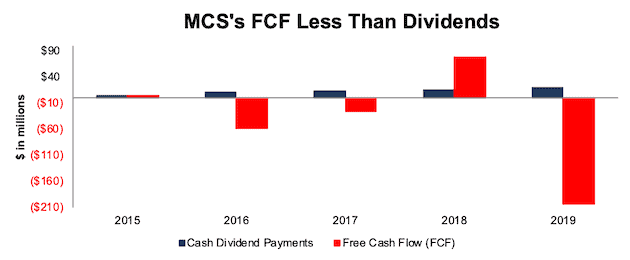
Sources: New Constructs, LLC and company filings
Consensus estimates expect MCS’s 2020 earnings to fall ~44% year-over-year (YoY), which would drive MCS’s cash flow even lower. With nearly $240 million in short and long-term debt, and just $21 million in cash and equivalents, MCS’s net debt represents 58% of its current market cap. In addition, MCS has over $240 million in operating leases (64% of market cap) that further increase its debt load. Should access to capital tighten, as lenders become more risk-off, MCS may be unable to borrow the funds needed to pay its dividend.
For a firm with already low profitability, significant debt, and declining cash flows, the business disruption caused by the COVID-19 pandemic poses a serious risk to the safety of its dividend. Investors can find similar dividend yields in firm’s with much stronger fundamentals.
This article originally published on March 30, 2020.
Disclosure: David Trainer, Kyle Guske II, and Matt Shuler receive no compensation to write about any specific stock, sector, style, or theme.
Follow us on Twitter, Facebook, LinkedIn, and StockTwits for real-time alerts on all our research.
Appendix 1 – “Real” Payout Ratios Revealed
The payout ratio, the amount of net income paid out as dividend, is a common metric used to analyze the safety of a dividend payment. The calculation for this metric is dividends per share divided by net income per share.
Using net income as the denominator in any calculation is problematic, due to the numerous accounting loopholes that make it easy for executives to manage earnings. In “Core Earnings: New Data and Evidence”, professors at Harvard Business School and MIT Sloan empirically show that managers manipulate earnings.
Rather than using GAAP net income, we can calculate a firm’s payout ratio based on its core earnings[2] to gain a more accurate view of a firm’s payout ratio. Firms with understated earnings have artificially high payout ratios, while those with overstated earnings have artificially low payout ratios.
Figure I: GAAP Payout Ratio Vs. Adjusted Payout Ratio – Based on 2019 Annual Dividends
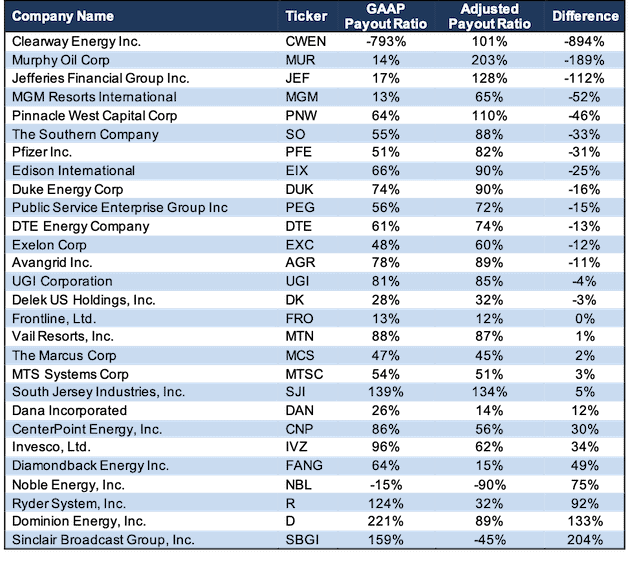
Sources: New Constructs, LLC and company filings
[1] Harvard Business School features the powerful impact of our research automation technology in the case New Constructs: Disrupting Fundamental Analysis with Robo-Analysts.
[2] Our core earnings are a superior measure of profits, as demonstrated in In Core Earnings: New Data & Evidence a paper by professors at Harvard Business School (HBS) & MIT Sloan. The paper empirically shows that our data is superior to IBES “Street Earnings”, owned by Blackstone (BX) and Thomson Reuters (TRI), and “Income Before Special Items” from Compustat, owned by S&P Global (SPGI).