
Check out this week’s Danger Zone interview with Chuck Jaffe of Money Life.
ETF dividends depend on the underlying cash flows of their holdings.
Our Robo-Analyst[1] identifies ETFs with seemingly attractive dividend yields, but with holdings that lack the cash flows to sustain the dividends. These ETFs are most at risk of cutting dividends and dividend yields, especially as economic conditions deteriorate. Risky dividend ETFs are in the Danger Zone this week.
Not All Dividend Yields Are Created Equal
High yielding ETFs hold great appeal for some investors. But, that appeal disappears if the underlying holdings of an ETF don’t generate the free cash flow needed to pay their promised dividends. Companies that don’t generate sufficient cash flows to sustain standard operations may be forced to reduce or cut dividend payments in an effort to sustain the business.
The more an ETF invests in stocks with risky dividend yields, the riskier the ETF’s own dividend yield becomes. Investors should focus on the core earnings and free cash flow of ETF holdings to assess the reliability of ETF dividend yields.
Here are the criteria we used to identify the ETFs with the riskiest dividend yields:
- A negative cumulative five-year FCF less than five-year dividend payments as a percent of enterprise value (FCF Deficit as % of Enterprise Value)
- Dividend yield greater than 4%
- A free cash flow (FCF) yield of 0% or worse over the trailing twelve month (TTM) period
- A Neutral-or-worse Risk/Reward rating
Figures 1 and 2 show the FCF deficit as a percent of enterprise value, dividend yield, and FCF yield of the five non-real estate investment trust (REIT) ETFs and five REIT ETFs under coverage that meet the above criteria. We separate REIT ETFs from other ETFs due to the unique risks of the REIT industry in the current environment – see Figure 2.
Figure 1: Riskiest ETF Dividend Yields – Non-REITs
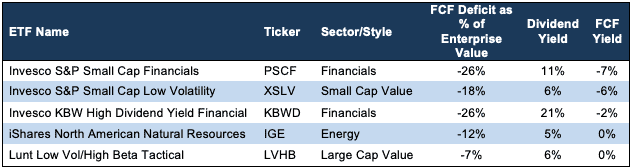
Excludes Real Estate Investment Trusts (REITs)
Sources: New Constructs, LLC and company filings.
Each of the ETFs in Figure 1 has a dividend yield significantly higher than its FCF yield and an aggregate FCF minus dividends deficit over the past five years. It’s worth noting that the three ETFs with the worst FCF yield and largest FCF deficit as a percent of enterprise value are Invesco funds.
The holdings in each of these ETFs have paid out significantly more in dividends than they have generated in FCF. In a slowing or contracting economy and with already negative FCF, we think it is clear to see why these firms, and the ETFs that hold them, are most at risk of cutting their dividends.
Dangerous Real Estate ETFs
The requirement of REITs to pay 90% of their taxable income out as dividends makes REIT stocks a favorite among dividend investors. Recent price declines have left many REITs with abnormally large dividend yields. However, investors should look closely at the sustainability of those dividends. Figure 2 shows the top five Real Estate ETFs that meet the criteria above.
Figure 2: Riskiest ETF Dividend Yields – REITs
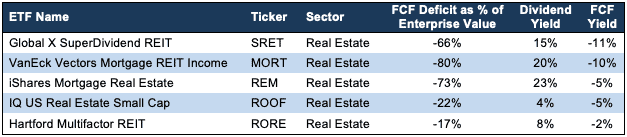
Sources: New Constructs, LLC
Cash flow in the Real Estate sector is especially at risk since many REITs will be facing difficult conditions in the coming months. Closed or struggling businesses unable to pay their debt or lease obligations could significantly reduce the core earnings and cash flows of many REITs.
Below, we’ll examine two of the riskiest dividend yield ETFs in more detail.
A Fund with a Dangerous Dividend Yield
Invesco KBW High Dividend Yield Financial ETF (KBWD) has a current dividend yield of 21%, which is sure to catch the eye of many investors. However, the -2% FCF yield of KBWD’s holdings casts major doubt about the sustainability of such a high yield.
By taking a closer look at each holding, we find that 25 of KBWD’s 32 holdings have cumulative five-year FCF less than their five-year dividend payments. With so many holdings already paying dividends above their means in good economic times, KBWD’s dividend looks hard to sustain.
Figure 3 compares KBWD against the sector benchmark, State Street Financial Select Sector SPDR (XLF) and the S&P 500 (SPY). While the dividend yield for KBWD is significantly higher, so too is the deficit between FCF and dividend payments as a percent of enterprise value. In other words, KBWD’s holdings can only pay dividends by issuing debt or equity or drawing down cash reserves. Or, they cut their dividends, a scenario much less likely for the holdings in XLF and SPY.
Figure 3: A Dangerous Dividend Yield: KBWD vs Benchmarks

Sources: New Constructs, LLC
Invesco, Ltd. (IVZ) – 16% dividend yield at risk
Invesco, Ltd. (IVZ) is one of KBWD’s risky dividend holdings. We recently highlighted IVZ as one of the stocks with the Riskiest Dividend Yields as well.
Invesco’s 16% dividend yield may draw investors’ attention, but they would be wise to turn away. The fundamentals of this business don’t support such a high dividend, and the looming economic downturn puts the dividend at even more risk. We wonder if KBWD holding this stock creates a conflict of interest.
Profitability Headed Down Before Recent Market Decline
IVZ’s fundamentals and profitability were already trending down before the recent market downturn. IVZ’s net operating profit after-tax (NOPAT) margin fell from 20% in 2018 to 19% in 2019. IVZ’s invested capital turns, a measure of capital efficiency, fell from 0.31 to 0.28 over the same time. The combination of falling margin and capital turns drove IVZ’s already low ROIC from 6% in 2018 to 5% in 2019.
Burning Cash in Recent Years
IVZ has generated negative free cash flow the last two years and burned a cumulative -$4.9 billion since 2015. However, the firm has paid out $2.5 billion in dividends over the same time. Figure 4 plots the $7.4 billion deficit between free cash flow and dividends since 2015. IVZ’s current FCF yield is -49%, which is well below the 4% average of Financials sector firms, and further illustrates the firm’s cash burn.
Figure 4: IVZ’s FCF Vs. Dividends Since 2015
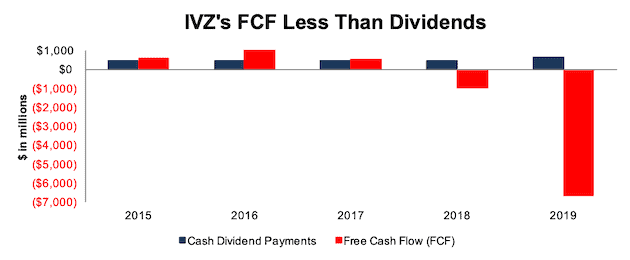
Sources: New Constructs, LLC and company filings
In 2019, IVZ’s net debt of $7.3 billion represents 209% of its current market cap. IVZ also has nearly $341 million in operating leases (10% of market cap) that further increase its debt load. Additionally, even before the recent market downturn, Invesco saw significant fund outflows and was attempting to reassure investors after Morningstar warned on the liquidity of some of its U.K. funds. Should investors take their capital elsewhere during or after the current crisis, IVZ could be forced to cut its dividend.
Don’t Trust This Real Estate ETF’s Dividend Yield
VanEck Vectors Mortgage REIT Income ETF (MORT) has a current dividend yield of 20%. This yield may lure investors unware of the underlying risk. 24 of MORT’s 25 holdings had cumulative five-year FCF less than its five-year dividend payments. It seems unlikely that companies burning cash in good economic times will be able to sustain their current level of dividends in bad times.
Figure 5 compares MORT against the sector benchmark, iShares U.S. Real Estate ETF (IYR) and SPY. While the dividend yield is significantly higher, so too is the deficit between FCF and dividend payments as a percent of enterprise value.
Figure 5: A Dangerous Dividend Yield: MORT vs Benchmarks

Sources: New Constructs, LLC
Arbor Realty Trust (ABR) – 30% dividend yield at risk
While ABR’s 30% dividend yield is sure to draw attention, a deeper look reveals this yield is at risk.
Profitability Already Trending Down
ABR’s profitably was headed in the wrong direction even before the recent economic slowdown. While NOPAT margin slightly increased from 30.0% in 2018 to 30.3% in 2019, ABR’s invested capital turns fell from 0.42 to 0.38 over the same time. The slight margin improvement was not enough to offset declining capital efficiency and ABR’s ROIC fell from 13% in 2018 to 11% in 2019.
Cash Burning Business
ABR has generated negative free cash flow in four of the past five years and burned -$440 million since 2015. At the same time, the firm paid out $384 million in dividends. Figure 6 plots the $824 million deficit between free cash flow and dividends since 2015. ABR’s current FCF yield is -18%, which is well below the Real Estate sector average of 0%, and highlights ABR’s significant cash burn.
Figure 6: ABR’s FCF vs. Dividends Since 2015
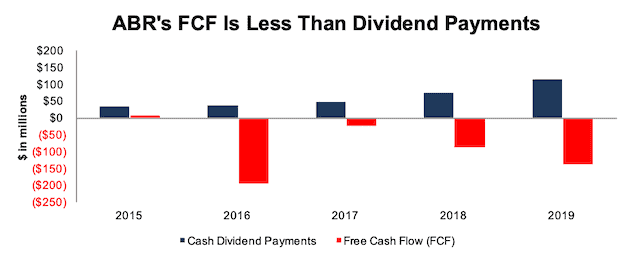
Sources: New Constructs, LLC and company filings
For a firm with already declining profitability and negative cash flows, the disruption caused by the COVID-19 pandemic, and its impact on consumers’ ability to make mortgage payments, poses a serious risk to the safety of ABR’s dividend. Investors can find much safer dividend yields elsewhere.
This article originally published on April 6, 2020.
Disclosure: David Trainer, Kyle Guske II, and Matt Shuler receive no compensation to write about any specific stock, sector, style, or theme.
Follow us on Twitter, Facebook, LinkedIn, and StockTwits for real-time alerts on all our research.
[1] Harvard Business School features the powerful impact of our research automation technology in the case New Constructs: Disrupting Fundamental Analysis with Robo-Analysts.