We closed the CAT position on July 19, 2021. A copy of the associated Position Update report is here.
Cash is king, especially in a severe economic decline. Only firms with strong core earnings will be able to sustain their dividends. We do the diligence on core earnings to measure the reliability of dividend yields. Earlier this week, we featured the Riskiest Dividend Yields. Safer dividend stocks are this week’s Long Idea.
Our Robo-Analyst[1] identifies firms with attractive dividend yields and the cash flows to sustain them. These firms are in a better position to maintain dividends in the future, even as economic conditions deteriorate.
Not All Dividend Yields Are Created Equal
High yielding dividend stocks hold great appeal for some investors. But, that appeal is only realized if the firm generates the free cash flow needed to pay its promised dividend.
Here are the criteria we used to identify the safest dividend yields:
- Dividend yield greater than 3.5%
- Positive free cash flow (FCF) yield over the trailing twelve month (TTM) period
- Cumulative five-year FCF greater than cumulative five-year dividend payments
- Net debt less than 25% of market cap
- A Neutral-or-better Risk/Reward rating
We then ranked these firms based on the surplus between FCF and dividend payments over the last five years.
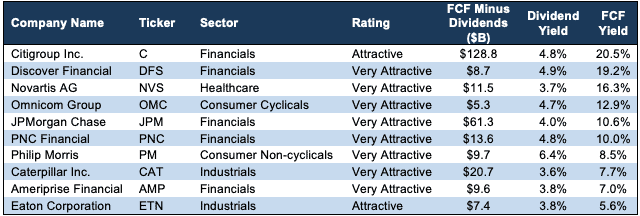
Figure 1 includes the firms with a FCF-minus-dividends surplus greater than $5 billion.
Figure 1: Safe Dividend Yields – FCF vs. Dividend Surplus Greater Than $5 Billion
Excludes Real Estate Investment Trusts (REITs)
Sources: New Constructs, LLC and company filings.
The firms in Figure 1 vary by industry, but each has generated significantly more in free cash flow than they have paid out in dividends over the past five years. In a slowing or even contracting economy, ample cash provides a life raft to ride out tough times while maintaining returns to shareholders.
As a byproduct of ample cash flows, some firms, such as Eaton Corporation (ETN), actually raised its dividend payment when it announced the most recent quarterly dividend in mid-February.
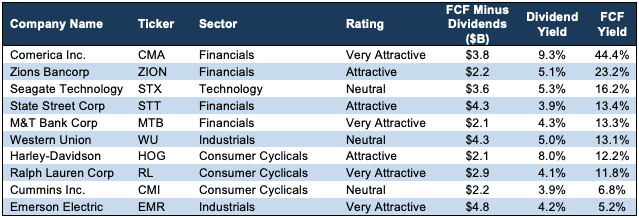
Figure 2 includes the firms with a FCF-minus-dividends surplus of greater than $2 billion but less than $5 billion.
Figure 2: Safe Dividend Yields – FCF vs. Dividend Surplus Between $2-$5 Billion
* Excludes Real Estate Investment Trusts (REITs)
Sources: New Constructs, LLC and company filings.
Figure 2 contains many Consumer Cyclicals firms that may see diminished demand as stores shutter amidst stay-at-home orders across the country. However, their high FCF yields and history of generating free cash flow above dividend payments provide an important margin of safety not found in many firms. For instance, Harley-Davidson (HOG) actually increased its dividend in mid-February, as other consumer goods firms with less cash were forced to cut.
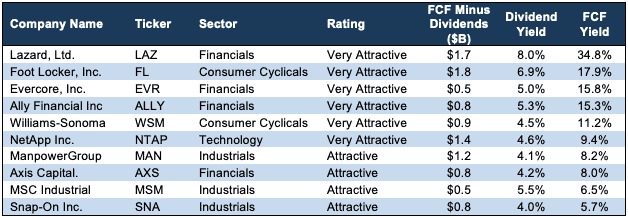
Figure 3 includes the firms with a FCF-minus-dividends surplus of less than $2 billion.
Figure 3: Safe Dividend Yields – FCF vs. Dividend Surplus Less than $2 Billion
* Excludes Real Estate Investment Trusts (REITs)
Sources: New Constructs, LLC and company filings.
With payout ratios as low as 16%, many of the firms in Figures 1-3 already pay dividends well below their means. See Appendix 1 for more details on payout ratios.
These companies have a higher likelihood to maintain dividends through the current downcycle. The excess cash flows provide them resources and flexibility to better manage operations while returning capital to shareholders. Below we’ll examine two firms in greater detail.
Williams-Sonoma Inc. (WSM) – 4.5% dividend yield
WSM currently provides a high-quality dividend yield of 4.5%. When we featured the stock as a Long Idea in February 2020, it was yielding just 2.6%. Now, with shares down nearly 50% year-to-date, investors have the opportunity to get a quality business at a discount with the added benefit of a higher dividend yield.
Profitability Improving Going into Downturn
WSM’s fundamentals and profitability have trended upwards in recent years, and the firm has generated ample cash flow. WSM’s invested capital turns, a measure of capital efficiency, increased from 1.76 in fiscal 2018 to 1.87 in fiscal 2019. WSM’s net operating profit after-tax (NOPAT) margin fell slightly from 7.0% to 6.8% over the same time. However, the improved capital efficiency was enough to offset the margin decline and WSM’s ROIC improved from 12.4% in fiscal 2018 to 12.7% in fiscal 2019.
Consistent Cash Generation
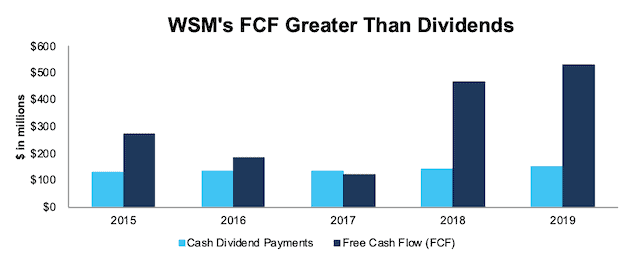
WSM has generated positive free cash flow in each of the past 15 years and generated a cumulative $1.6 billion (55% of market cap) since 2015. WSM paid out $687 million in dividends over the same time. Figure 4 plots the $882 million surplus between free cash flow and dividends since 2015.
The firm’s FCF yield of 11%, is well above the Consumer Cyclicals sector average of 1% and further illustrates the firm’s cash generation.
Figure 4: WSM’s FCF Vs. Dividends Since 2015
Sources: New Constructs, LLC and company filings
WSM’s high profitability and cash generation allows the firm to operate with no net debt. In fiscal 2019, WSM had $300 million in debt and $432 million in cash and equivalents, which equates to $132 million in net cash. With net cash, and an existing credit revolver, WSM is in a better position to withstand the current economic downturn and preserve its dividend, just as it did during the 2008/2009 global recession.
Caterpillar Inc. (CAT) – 3.6% dividend yield
While Caterpillar’s 3.6% dividend yield is not the highest in Figures 1-3, it is twice its January 2018 level. Investors searching for yield have the chance to get a cash flow machine at a discount with a yield last seen in late 2016.
Profitability Trending in the Right Direction
Even after declining slightly in 2019, CAT’s operational and capital efficiency are much improved since 2016. CAT’s NOPAT margin has increased from 4.5% in 2016 to 12.1% in 2019. CAT’s invested capital turns have improved from 1.05 to 1.22 over the same time. The combination of rising margin and capital turns drove CAT’s ROIC from 5% in 2016 to a top-quintile 15% in 2019.
Cash Flow Machine
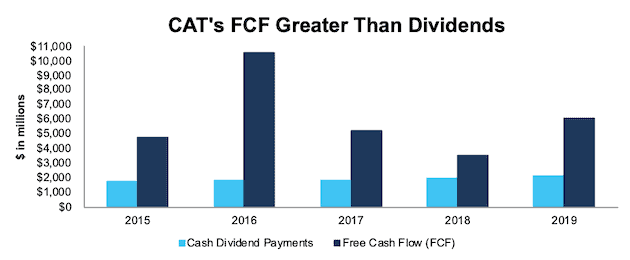
CAT has generated positive free cash flow in 12 of the past 15 years while generating a cumulative $30.2 billion (49% of market cap) since 2015. The firm has paid out over $9.5 billion in dividends over the same time. Figure 5 plots the $20.7 billion surplus between free cash flow and dividends since 2015. CAT’s current FCF yield is 8%, which is well above the Industrials sector average of 2%, and highlights CAT’s significant cash generation.
Figure 5: CAT’s FCF vs. Dividends Since 2015
Sources: New Constructs, LLC and company filings
CAT’s profitability and consistent cash flows provide the firm the advantage of operating with little net debt. In 2019, CAT had $9.1 billion in debt and $7.3 billion in cash and equivalents, which equates to $1.8 billion in net debt, or just 3% of market cap. In other words, CAT is well positioned to weather a downturn while persevering its dividend, as it did during 2008-2009.
This article originally published on April 1, 2020.
Disclosure: David Trainer, Kyle Guske II, and Matt Shuler receive no compensation to write about any specific stock, sector, style, or theme.
Follow us on Twitter, Facebook, LinkedIn, and StockTwits for real-time alerts on all our research.
Appendix 1 – “Real” Payout Ratios Revealed
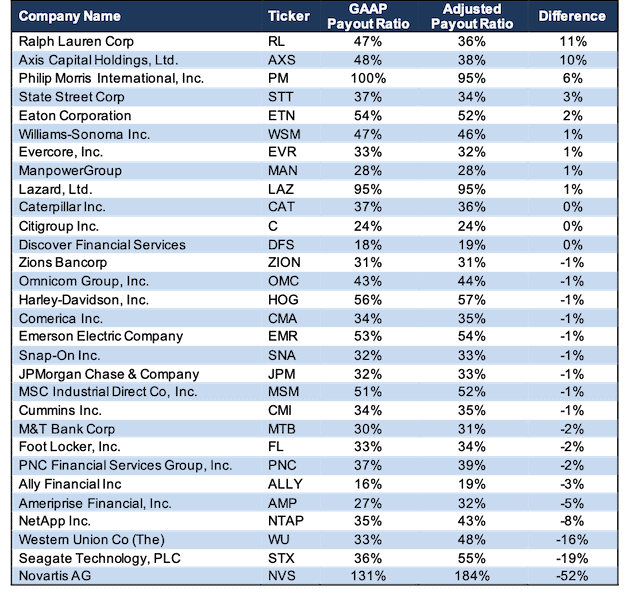
The payout ratio, the amount of net income paid out as dividend, is a common metric used to analyze the safety of a dividend payment. The calculation for this metric is dividends per share divided by net income per share.
Using net income as the denominator in any calculation is problematic, due to the numerous accounting loopholes that make it easy for executives to manage earnings. In “Core Earnings: New Data and Evidence”, professors at Harvard Business School and MIT Sloan empirically show that managers manipulate earnings.
Rather than using GAAP net income, we can calculate a firm’s payout ratio based on its core earnings[2] to gain a more accurate view of a firm’s payout ratio. Firms with understated earnings have artificially high payout ratios, while those with overstated earnings have artificially low payout ratios.
Figure I: GAAP Payout Ratio Vs. Adjusted Payout Ratio – Based on 2019 Annual Dividends
Sources: New Constructs, LLC and company filings
[1] Harvard Business School features the powerful impact of our research automation technology in the case New Constructs: Disrupting Fundamental Analysis with Robo-Analysts.
[2] Our core earnings are a superior measure of profits, as demonstrated in In Core Earnings: New Data & Evidence a paper by professors at Harvard Business School (HBS) & MIT Sloan. The paper empirically shows that our data is superior to IBES “Street Earnings”, owned by Blackstone (BX) and Thomson Reuters (TRI), and “Income Before Special Items” from Compustat, owned by S&P Global (SPGI).

1 Response to "Safest Dividend Yields"
David
I hope y’all are doing ok down in Nashville.
Looking forward to being back down soon
Frank