We originally featured this retailer in September 2016, and since then, its stock has increased 52% (vs. S&P 500 +59%). We attribute this slight underperformance to investors’ fear of the “Retail Apocalypse” because it’s not warranted by the firm’s fundamentals. With a track record of profit growth, newly improved corporate governance and a cheap stock price, Williams-Sonoma (WSM: $74/share) is this week’s Long Idea.
WSM’s Profitability Stands Out in a Difficult Industry
Williams-Sonoma, a global retailer of home goods and furnishings, has embraced e-commerce and leveraged a “digital-first” approach to consistently grow its revenue and profits. Over the past five years, revenue at each business segment have grown:
- West Elm – 20% compounded annually
- Other (international franchise, Rejuvenation, and Mark and Graham) – 15% compounded annually
- Pottery Barn – 3% compounded annually
- Williams Sonoma – 2% compounded annually
- Pottery Barn Kids and Teen – 1% compounded annually
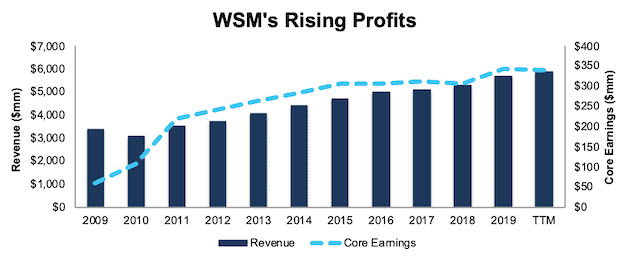
Over the past decade, WSM has grown overall revenue by 5% compounded annually and core earnings[1] by 19% compounded annually, per Figure 1.
Figure 1: WSM’s Revenue & Core Earnings Since 2009
Sources: New Constructs, LLC and company filings.
In the retail industry, where many firms are burning through cash or declaring bankruptcy, WSM bucks the trend. The firm has generated positive free cash flow each year since 2006 and generated a cumulative $1.2 billion (20% of market cap) in free cash flow over the past five years.
Adding ROIC to Executive Compensation is a Welcome Improvement
When we originally featured WSM as a Long Idea, the firm awarded long-term stock units based on EPS and operating cash flow goals. In fiscal 2018, WSM revised its long-term performance stock incentive plan to incorporate four equally-weighted metrics, one of which is three-year average ROIC.
We know there is a strong correlation between improving ROIC and shareholder value, and WSM management agrees. In its fiscal 2018 10-K, the firm notes “ROIC is a useful financial measure for investors in evaluating the efficient and effective use of capital, and is an important component of long-term shareholder return.”
WSM’s management has also focused on ROIC in its 2018 and 2019 investor presentations, with the latter highlighting “profitable growth with high ROIC” as one of its four business mandates.
WSM’s decision to include ROIC in its executive compensation plan will better align executives’ interests with shareholders’ interests. Furthermore, it reduces the risks of investing in the company because we know executives will be held accountable for poor capital stewardship.
WSM’s Profitability Ranks High Amongst Peers
WSM’s profitability ranks at or near the top of the other home furnishing retailers in our coverage universe, which include Restoration Hardware (RH), Haverty Furniture (HVT), At Home Group (HOME), Bed Bath & Beyond (BBBY), Kirkland’s (KIRK) and Pier 1 Imports (PIR). Per Figure 2, WSM earns the second highest net operating profit after-tax (NOPAT) margin amongst competitors.
Figure 2: WSM’s NOPAT Margin Vs. Competitors

Sources: New Constructs, LLC and company filings.
WSM’s capital efficiency is also top amongst competitors. Per Figure 3, WSM generates the second highest invested capital turns, which measure capital efficiency.
Figure 3: WSM’s Invested Capital Turns Vs. Competitors

Sources: New Constructs, LLC and company filings.
The combination of high margins and invested capital turns drives WSM’s high ROIC. WSM’s 13% ROIC over the trailing-twelve-month (TTM period) is equal to its average ROIC over the past five years. Per Figure 4, WSM’s TTM ROIC currently ranks above all peers, with the exception of RH.
Figure 4: WSM’s ROIC vs. Competitors

Sources: New Constructs, LLC and company filings.
WSM’s superior profitability shows that its investment in e-commerce, omni-channel capabilities, and diversified brands give it an advantage.
Diversified Product Offering Increases Market Opportunity
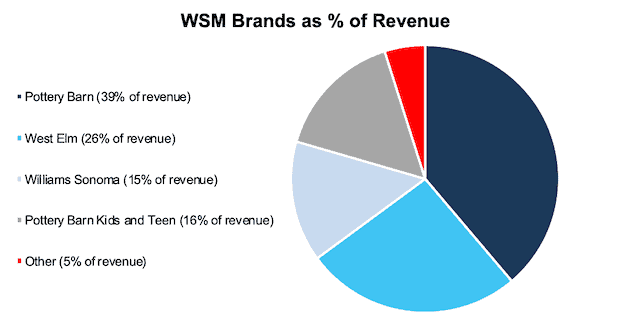
To successfully compete in the highly fragmented home furnishings market, WSM leverages multiple brands to match the style preferences and price points of multiple consumer groups. Per Figure 5, these brands create a diversified revenue stream and an opportunity for WSM to target consumers throughout their lives as income and preferences change.
Figure 5: Williams-Sonoma Brand Revenue Breakdown – Nine Months Ended November 3, 2019
Sources: New Constructs, LLC and company filings
West Elm, WSM’s fastest growing brand over the past five years, is lower priced, and has a more modern design. Williams Sonoma Home and Rejuvenation are higher priced, and more traditional in design. Pottery Barn sits in the middle, with offerings on the high and low end of pricing, as well as offshoots designed specifically for babies, kids, and teens.
These different brands increase WSM’s total addressable market while also creating the opportunity to cross-sell throughout the firm’s relationship with a customer. Cross-selling lowers customer acquisition costs and actually increases the revenue generated per customer. WSM noted in its September 2019 Investor Presentation that customers shopping at more than one of its brands spend four times more than customers shopping at just one brand. With just 30% of its total customers currently shopping across different brands, there’s a lot of room for WSM to grow that customer segment.
Customer Rewards Program Increases Sales and Brand Loyalty
Launched in late 2016, WSM’s rewards program, The Key, gives 3% back in rewards on purchases, exclusive offers, and free design services. After adding 800,000 members in fiscal 3Q19, The Key now has 7.2 million members.
Increasing The Key membership is another growth driver for WSM. In fiscal 3Q19, management noted that The Key members spend, on average, three times more and have double the purchase frequency when compared to non-key members. Furthermore, The Key members spend over five times the value of their rewards.
By adding members to The Key, WSM can market and promote across all brands to existing customers likely to spend more, thereby driving sales with minimal additional costs.
What E-Commerce Threat?
We’ve pointed out the popular “Retail Apocalypse” is overstated. There are certainly weak firms that cannot compete in the modern retail market (such as Pier 1, which recently filed for bankruptcy), but investors should not assume all retailers will meet the same fate. Despite its successes, too many investors treat WSM like a weaker retailer (see short interest section below for more details).
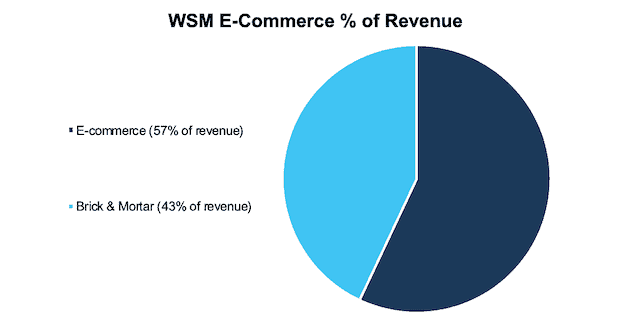
However, Williams-Sonoma properly anticipated the shift to e-commerce, and has been growing its online footprint for years. Per Figure 6, e-commerce represented 57% of total revenue at the end of fiscal 3Q19. In fiscal 2018, it was named one of the top 25 e-commerce retailers in North America. For reference, WSM’s e-commerce represented ~40% of total revenue in 2010.
Figure 6: Williams-Sonoma E-Commerce vs. Brick & Mortar Revenue – Fiscal 3Q19
Sources: New Constructs, LLC and company filings
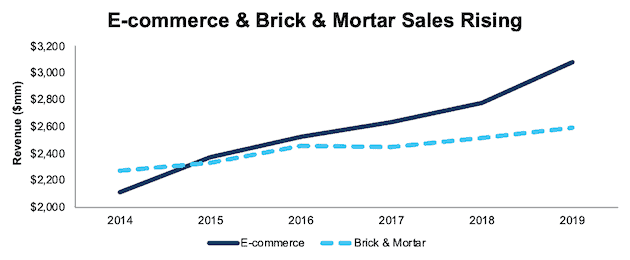
WSM’s e-commerce success has not been the only driver of overall revenue growth either. Per Figure 7, e-commerce revenue has grown by 8% compounded annually while brick & mortar revenue has grown 3% compounded annually over the past five years. The ability to grow both e-commerce and brick & mortar sales shows WSM’s investment in its omni-channel experience is working.
Figure 7: WSM’s E-commerce and Brick & Mortar Revenue Since 2014
Sources: New Constructs, LLC and company filings.
Brick & Mortar Stores Still Drive Growth
As online-only firms increasingly add more brick & mortar locations, they prove the “retail apocalypse” narrative is not true. WSM notes in its Investor Presentation that over 80% of sales in the industry still occur in physical stores. A healthy brick & mortar footprint is a competitive advantage for WSM.
With its success in e-commerce, WSM can focus on leveraging its physical stores to drive additional revenue. WSM has launched in-store design services to drive increased sales in stores as well as (now commonplace) buy online and pickup in-store options. WSM’s CEO, Laura Alber, described the advantage a store base provides in the firm’s fiscal 2Q19 conference call:
“The advantage we have is that we're a great online player, but we also have these retail stores that give the customer the confidence about the quality and allows them to go visit things somewhere near them.”
To maintain the firm’s overall profitability, WSM is also looking to close underperforming stores and remodel others. WSM’s total store count actually declined in fiscal 2018, for the first time in over five years. WSM’s management expects 25 net store closures (4% of total stores) in fiscal 2019. Despite closing stores, total sales continued to rise in fiscal 2018 and management expects an increase in sales in fiscal 2019, which highlights the strength of WSM’s overall business.
China Tariffs Aren’t Much of a Concern
Retailers across the industry have warned that tariffs on goods imported from China will have an adverse impact on their financials, lead to increased prices for consumers, or both. The recent signing of the “phase one” deal with China will limit some tariffs, but others remain in place.
However, WSM management reiterated in its fiscal 3Q19 conference call that it has multiple strategies in place to minimize the impact of these tariffs. The firm has already moved some production out of China and renegotiated product costs with Chinese vendors. Additionally, it has “selectively” increased prices while reducing the level of promotions offered to offset cost pressures brought on by the tariffs.
Long-term, WSM has stated it is looking to re-source goods and cut its exposure to China in half by the end of 2020. On the fiscal 3Q19 conference call, WSM’s CFO, Julie Whalen, noted the firm is halfway to that goal.
Going forward, any reduction in China tariffs would provide an additional boost to WSM’s business.
Despite Strong Fundamentals, WSM Remains Undervalued
Numerous case studies show that getting ROIC right is an important part of making smart investments. This paper compares our analytics on a mega cap company to Bloomberg and Capital IQ (SPGI) in a detailed appendix. The technology that enables this research is featured by Harvard Business School.
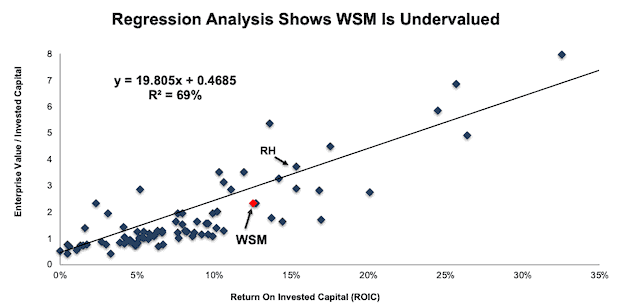
Per Figure 8, ROIC explains 69% of the difference in valuation for the 96 Specialty Retailers in our coverage universe. WSM trades at a discount to peers as shown by its position below the trend line.
Figure 8: ROIC Explains 69% of Difference in Valuation for Specialty Retailers
Sources: New Constructs, LLC and company filings.
If the stock were to trade at parity with its industry group, it would be worth $101/share – 36% above the current stock price. Given its status as a leading online retailer, and one of the most profitable companies in the industry, WSM deserves a premium valuation to its peers.
Cheap Valuation Provides Upside
Williams-Sonoma’s cheap valuation means that the stock still has significant upside potential. At its current price of $74/share, the stock has a price to economic book value (PEBV) ratio of 1.1. This ratio means the market expects WSM’s NOPAT to grow by no more than 10% over the remaining life of the firm. This expectation seems rather pessimistic given WSM has grown NOPAT by 13% compounded annually over the past decade and 10% compounded annually over the past two decades.
Below, we use our reverse DCF model to see what the stock could be worth given conservative assumptions about future growth in cash flows.
If WSM can maintain TTM NOPAT margins of 7% and grow NOPAT by just 4% compounded annually (in-line with expected industry growth) over the next decade, the stock is worth $92/share today – a 24% upside to the current stock price. See the math behind this reverse DCF scenario.
Sustainable Competitive Advantages Will Drive Shareholder Value Creation
Here’s a summary of why we think the moat around WSM’s business will enable it to continue to generate higher NOPAT than the current market valuation implies. The following competitive advantages help WSM offer more products at competitive prices and prevent competition from taking market share:
- Significant (over half of revenue) and growing e-commerce business
- Higher margins than majority of competitors
- Existing store base provides more hands-on sales experience
- Member rewards program creates increased customer retention
What Noise Traders Miss with WSM
These days, fewer investors focus on finding quality capital allocators with shareholder friendly corporate governance. Instead, due to the proliferation of noise traders, the focus is on technical trading trends while high-quality fundamental research is overlooked. Here’s a quick summary of what noise traders are missing:
- Significant free cash flow provides resources to pursue growth opportunities
- Retail Apocalypse narrative is overstated and e-commerce is actually a strength of WSM
- Valuation implies minimal future growth in profits
More Earnings Beats and New Business Segments Could Drive Shares Higher
WSM beat earnings estimates in each of the past 13 quarters and revenue estimates in 10 of the past 13 quarters. Beating expectations can boost shares, as it did in May 2019 when shares jumped 13% the day after WSM surpassed both earnings and revenue expectations. Though our current Earnings Distortion Score for WSM is “In-Line”, additional earnings beats could have a similar impact on the stock moving forward.
To continue sales and profit growth, WSM introduced its new business-to-business division in March 2019. This segment will focus on providing furnishings for commercial workplaces, senior living centers, hospitals, multi-family units, university housing, and more.
Williams-Sonoma announced in May 2019 that it would furnish areas, such as courtside lounges, club suites, and corporate offices, in the Golden State Warriors new arena, showcasing the early success of this new division. Management believes this division could generate $2 billion in annual revenues and, in fiscal 3Q19, it drove 100 basis points in comparable sales growth for the entire company.
Growth in this new business, along with continued growth in its other brands should drive shares higher over the long-term. In the meantime, investors are rewarded with a 6% yield, as we’ll show below.
Dividends and Buybacks Offer Over 6% Yield
WSM has increased its dividend in each of the last 10 years. From fiscal 2014-2018, WSM increased its dividend by 7% compounded annually. The current annualized dividend of $1.92 gives the stock a dividend yield of 2.6%.
In addition to dividends, WSM returns capital to shareholders through share repurchases. In fiscal 2018, WSM repurchased $295 million worth of shares. Over the TTM, WSM repurchased $189 million (3.4% of market cap) worth of shares. WSM has $611 million remaining on its current buyback authorization, which has no expiration date.
If WSM repurchases shares in line with the TTM period, we would expect it to repurchase up to 3.4% of the current market cap. When combined with a 2.6% dividend yield, WSM has a total shareholder yield of 6.0%.
Insider Trading is Minimal and Short Interest Reflects Pessimism
Over the past 12 months, insiders have made no purchases and have sold 349 thousand shares for a net effect of 349 thousand shares sold. These share sales represent less than 1% of shares outstanding.
There are currently 7.7 million shares sold short, which equates to 10% of shares outstanding and 8 days to cover. Short interest is down 6% from the prior month. High short interest indicates the market’s pessimism for retailers and increases the chances of a short squeeze should WSM report positive guidance and/or an earnings beat.
Critical Details Found in Financial Filings by Our Robo-Analyst Technology
As investors focus more on fundamental research, research automation technology is needed to analyze all the critical financial details in financial filings as shown in the Harvard Business School and MIT Sloan paper, "Core Earnings: New Data and Evidence”.
Below are specifics on the adjustments we make based on Robo-Analyst findings in Williams-Sonoma’s 2019 10-K:
Income Statement: we made $203 million of adjustments with a net effect of removing $65 million of non-operating expenses (1% of revenue). See all adjustments made to WSM’s income statement here.
Balance Sheet: we made $1.7 billion of adjustments to calculate invested capital with a net increase of $1.4 billion. One of the most notable adjustments was $1.4 billion (79% of reported net assets) in operating leases. See all adjustments to WSM’s balance sheet here.
Valuation: we made $1.8 billion of adjustments with a net effect of decreasing shareholder value by $1.8 billion. Apart from total debt, which includes the operating leases noted above, the most notable adjustment to shareholder value was $2 million in net deferred compensation assets. This adjustment represents less than 1% of WSM’s market cap. See all adjustments to WSM’s valuation here.
Attractive Funds That Hold WSM
The following funds receive our Attractive-or-better rating and allocate significantly to Williams-Sonoma.
- State Street SPDR S&P Homebuilders ETF (XHB) – 3.8% allocation and Very Attractive rating
- Monongahela All Cap Value Fund (MCMVX) – 3.7% allocation and Attractive rating
- AIG ESG Dividend Fund (EDFCX, EDFWX) – 3.1% allocation and Very Attractive rating
- Invesco Dynamic Retail ETF (PMR) – 2.3% allocation and Very Attractive rating
This article originally published on February 19, 2020.
Disclosure: David Trainer, Kyle Guske II, and Matt Shuler receive no compensation to write about any specific stock, style, or theme.
Follow us on Twitter, Facebook, LinkedIn, and StockTwits for real-time alerts on all our research.
[1] In Core Earnings: New Data & Evidence, professors at Harvard Business School (HBS) & MIT Sloan empirically demonstrate the superiority of our measure of core earnings.
