
The precipitous drop in 4Q22 GAAP earnings compared to Core Earnings highlights the more stable nature of Core Earnings. Because we remove unusual gains and losses, the Core Earnings metric is not susceptible to the kitchen-sink effect that torpedoes 4Q22 GAAP Earnings. For the first time since 3Q20, Core Earnings fell quarter-over-quarter (QoQ), albeit less than 1%. Only four of eleven sectors saw a QoQ rise in Core Earnings in the trailing-twelve months (TTM) ended 4Q22, versus six in 3Q22.
The Healthcare and Energy sectors continue to show remarkable Core Earnings growth.
This report is an abridged and free version of S&P 500 & Sectors: GAAP Earnings Continue to Fall in 4Q22, one of our quarterly series of reports on fundamental market and sector trends.
The full version of the report analyzes Core Earnings[1],[2] and GAAP earnings for the S&P 500 and each of its sectors (last quarter’s analysis is here). The full reports are available to Professional and Institutional members.
Generally Accepted Accounting Distortions
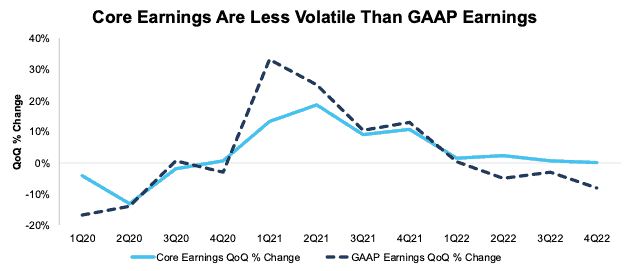
Figure 1 in the full report shows GAAP Earnings for the S&P 500 understated Core Earnings for the third consecutive quarter, after trailing GAAP earnings spiked to record levels in 1Q22. Corporate profits as measured by Core Earnings have been much less volatile than GAAP earnings suggest, especially since 1Q20. For example, per Figure 2, in the TTM ended:
- 1Q21, GAAP earnings rose 33% QoQ compared to a 13% rise for Core Earnings.
- 2Q22, GAAP earnings fell 5% QoQ compared to a 2% rise in Core Earnings.
- 3Q22, GAAP earnings fell 3% QoQ compared to a 1% rise for Core Earnings.
- 4Q22, GAAP earnings fell 8% QoQ compared to no change in Core Earnings.
Figure 1: S&P 500 Core Earnings Vs. GAAP Earnings QoQ Percent Change: 1Q20 – 4Q22
Sources: New Constructs, LLC and company filings.
Our Core Earnings analysis is based on aggregated TTM data for the sector constituents in each measurement period.
The March 8, 2023 measurement period incorporates the financial data from calendar 2022 10-Ks, as this is the earliest date for which all the calendar 2022 10-Ks for the S&P 500 constituents were available.
This report leverages our cutting-edge Robo-Analyst technology to deliver proven-superior[3] fundamental research and support more cost-effective fulfillment of the fiduciary duty of care.
GAAP Earnings[4] Understate Core Earnings for Nearly Three Fourths the S&P 500 (by Market Cap)
70%, or 348, of the companies in the S&P 500 report GAAP Earnings that understate Core Earnings for the TTM ended 4Q22.
When GAAP Earnings understate Core Earnings, they do so by an average of 72%, per Figure 2. GAAP Earnings understated Core Earnings by more than 10% for 35% of companies. For comparison, in the TTM ended 3Q22, 314 companies had understated GAAP earnings.
Figure 2: S&P 500 GAAP Earnings Understated by 72% On Average

Sources: New Constructs, LLC and company filings.
We use Funds from Operations (FFO) for Real Estate companies rather than GAAP Earnings.
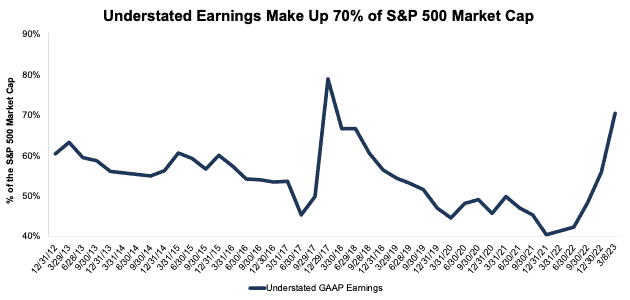
The 348 companies with understated GAAP Earnings make up 70% of the market cap of the S&P 500 as of 3/8/23. 4Q22 has the most understated GAAP earnings (by market cap) since 3Q17.
Companies with understated GAAP earnings made up 56% of the S&P 500 market cap in 3Q22 and 41% of the S&P 500 market cap in 4Q21.
Figure 3: Understated Earnings as % of Market Cap: 2012 through 3/8/23
Sources: New Constructs, LLC and company filings.
Key Details on Select S&P 500 Sectors
Four of eleven sectors saw a quarter-over-quarter rise in Core Earnings through the trailing-twelve months (TTM) ended 4Q22, compared to six in 3Q22.
The Industrials sector saw the largest QoQ improvement in Core Earnings, which rose from $135.2 billion in 3Q22 to $146.7 billion in 4Q22, or 8%.
At $451.3 billion, the Technology sector generates the most Core Earnings, and saw Core Earnings fall 2% QoQ in 4Q22. On the flip side, the Real Estate sector has the lowest Core Earnings at $22.9 billion, and the Telecom Services sector had the largest QoQ decline in 4Q22 at -11%.
Below we highlight the Basic Materials sector and a stock with some of the most negative Earnings Distortion (i.e. understated GAAP earnings) in the sector.
Sample Sector Analysis[5]: Basic Materials Sector
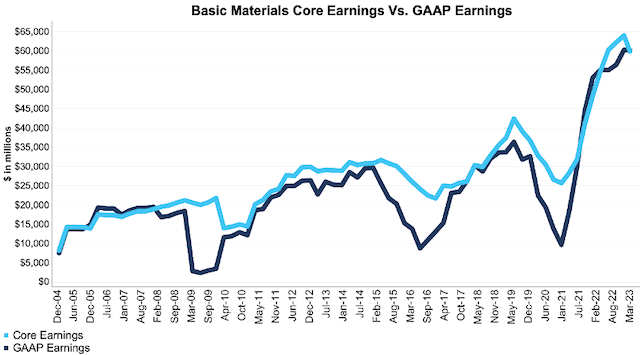
Figure 4 shows Core Earnings for the Basic Materials sector, at $59.9 billion, fell 6% QoQ in 4Q22 while GAAP earnings, at $60.2 billion, were flat over the same time.
Figure 4: Basic Materials Core Earnings Vs. GAAP: 2004 – 4Q22
Sources: New Constructs, LLC and company filings.
Our Core Earnings analysis is based on aggregated TTM data for the sector constituents in each measurement period.
The March 8, 2023 measurement period incorporates the financial data from calendar 2022 10-Ks, as this is the earliest date for which all the calendar 2022 10-Ks for the S&P 500 constituents were available.
GAAP Earnings Understatement Details: Dow Inc. (DOW)
Below, we detail the hidden and reported unusual items that overlooked in GAAP Earnings captured in Core Earnings for Dow Inc. After adjusting for unusual items, we find that Dow’s Core Earnings of $5.0 billion, or $6.86/share are much higher than reported GAAP Earnings of $4.6 billion, or $6.31/share.
Dow’s Earnings Distortion Score is Beat and its Stock Rating is Attractive, in part due to its positive economic earnings and price-to-economic book value (PEBV) ratio of 0.7. We made Dow a Long Idea in September 2022. The stock is up 9% while the S&P is up 1% since then. The stock remains undervalued.
Below, we detail the differences between Core Earnings and GAAP Earnings so readers can audit our research.
Figure 5: Dow’s GAAP Earnings to Core Earnings Reconciliation

Sources: New Constructs, LLC and company filings.
More details:
Total Earnings Distortion of -$0.54/share, which equals -$394 million, is comprised of the following:
Hidden Unusual Expenses Pre-Tax, Net = -$0.30/per share, which equals -$220 million and is comprised of:
- -$230 million in digitalization program costs bundled in Corporate costs
- $10 million in sublease income
Reported Unusual Expenses Pre-Tax, Net = -$0.54/per share, which equals $390 million and is comprised of:
- -$662 million in interest expense and amortization of debt discount
- -$337 million contra adjustment for recurring pension costs. These recurring expenses are reported in non-recurring line items, so we add them back and exclude them from Earnings Distortion.
- -$118 million restructuring and asset related charges
- -$117 million in foreign exchanges losses
- -$8 million loss on early extinguishment of debt
- -$4 million in indemnification and other transaction-related costs
- $31 million in Other Income
- $60 million in Dow Silicones breast implant liability adjustment
- $78 million gain on sales of other assets and investments
- $321 million gain related to Nova legal matter
- $358 million in non-operating pension and other post-retirement benefit plan net credits
Tax Distortion = $0.30/per share, which equals $216 million
This article was originally published on March 22, 2023.
Disclosure: David Trainer, Kyle Guske II, and Italo Mendonça receive no compensation to write about any specific stock, style, or theme.
Follow us on Twitter, Facebook, LinkedIn, and StockTwits for real-time alerts on all our research.
Appendix: Calculation Methodology
We derive the Core Earnings and GAAP Earnings metrics above by summing the Trailing Twelve Month individual S&P 500 constituent values for Core Earnings and GAAP Earnings in each sector for each measurement period. We call this approach the “Aggregate” methodology.
The Aggregate methodology provides a straightforward look at the entire sector, regardless of market cap or index weighting and matches how S&P Global (SPGI) calculates metrics for the S&P 500.
[1] The Journal of Financial Economics features the superiority of our Core Earnings in Core Earnings: New Data & Evidence.
[2] Based on the latest audited financial data, which is the calendar 2022 10-K in most cases. Price data as of 3/8/23.
[3] Our research utilizes our Core Earnings, a more reliable measure of profits, as proven in Core Earnings: New Data & Evidence, written by professors at Harvard Business School (HBS) & MIT Sloan and published in The Journal of Financial Economics.
[4] Overstated companies include all companies with Earnings Distortion >0.1% of GAAP earnings.
[5] The full version of this report provides analysis for all eleven sectors.