
Our report on Overstated Street Earnings in 3Q23 shows Street Earnings (based on Zacks Earnings) overstate profits for the majority of S&P 500 companies in 3Q23. However, there are 131 S&P 500 companies with TTM 3Q23 Street Earnings that are lower than their true profits, i.e. Core Earnings[1],[2]. These companies are more profitable than investors realize and, in many cases, undervalued as well.
This report shows:
- the magnitude of understated Street Earnings in the S&P 500,
- why Street Earnings (and GAAP earnings) are flawed, and
- five S&P 500 companies with understated Street Earnings and Attractive-or-better Stock Ratings.
131 S&P 500 Companies Have Understated Street Earnings
For 131 companies in the S&P 500, or 26%, Street Earnings are lower than Core Earnings in the trailing-twelve-months (TTM) ended 3Q23. In the TTM ended 2Q23, Street Earnings were understated for 136 companies.
When Street Earnings are lower than Core Earnings, they are understated by an average of 22% per company, per Figure 1.
Figure 1: Street Earnings Understated by 22% on Average in TTM Through 3Q23[3]

Sources: New Constructs, LLC and company filings.
The 131 companies with understated Street Earnings represent 24% of the market cap of the S&P 500 as of 11/14/23, which is down from 29% in the TTM ended 2Q23.
Note that this analysis is based on our team analyzing the financial statements and footnotes for ~3,000 10-Ks and 10-Qs filed with the SEC in the last few weeks. We estimate that the cost of this work for most firms would be around $1 million each quarter. To say the least, there is tremendous value in our rigorous analysis of these filings across so many companies so that our clients and discern the best and worst stocks with unrivaled diligence.
Figure 2: Understated Street Earnings as % of Market Cap: 2012 through 11/14/23
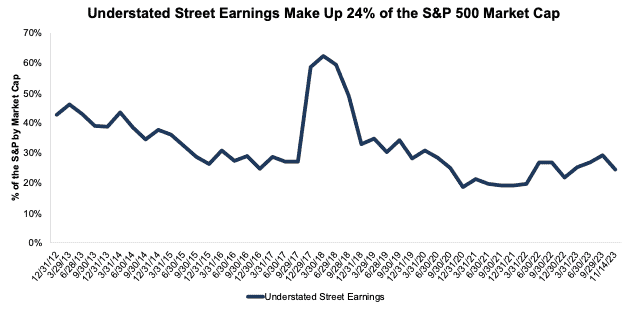
Sources: New Constructs, LLC and company filings.
For 43 companies, Street Earnings are overstated by more than 10% vs. Core Earnings. These 43 companies make up 10% of the market cap of the S&P 500 as of 11/14/23. See Figure 3.
Figure 3: Understated Street Earnings by 10% as % of Market Cap: 2012 through 11/14/23
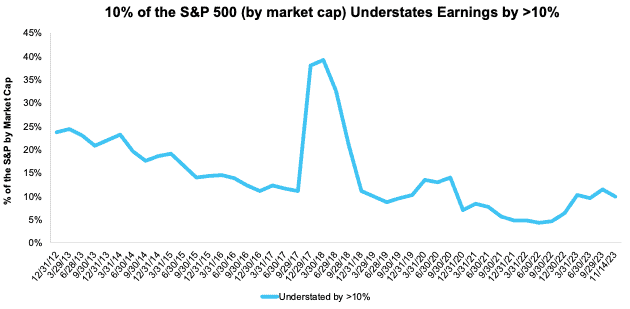
Sources: New Constructs, LLC and company filings.
The Five Most Understated Earnings in the S&P 500
Figure 4 shows five S&P 500 stocks with Attractive-or-better Stock Ratings and the most understated Street Earnings (based on Street Distortion as a % of Street Earnings per share) in the TTM ended 3Q23. “Street Distortion” equals the difference between Core and Street Earnings on a per share basis. Investors relying only on Street Earnings miss the true profitability of these businesses.
Figure 4: S&P 500 Companies with Most Understated Street Earnings: TTM 3Q23
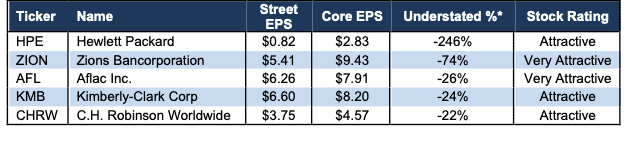
Sources: New Constructs, LLC and company filings.
*Measured as Street Distortion as a percent of Street EPS
In the section below, we detail the hidden and reported unusual items that distort GAAP Earnings for Kimberly-Clark Corp (KMB). All these unusual items are removed from Core Earnings.
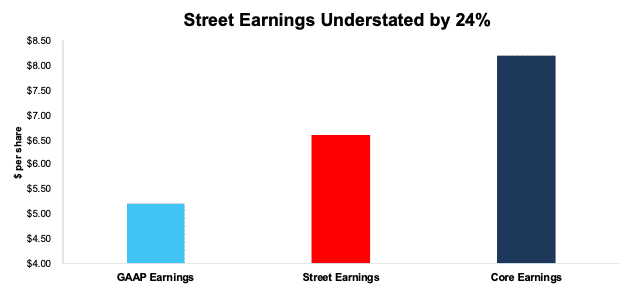
Kimberly-Clark’s TTM 3Q23 Street Earnings Understated by $1.60/share
The difference between, or Street Distortion in, Kimberly-Clark’s TTM 3Q23 Street Earnings ($6.60/share) and Core Earnings ($8.20/share) is $1.60/share, or 24% of Street Earnings.
Kimberly-Clark’s TTM 3Q23 GAAP Earnings ($5.20/share) are $3.00/share lower than Core Earnings, which indicates that Street Earnings do identify some unusual expenses, but they still miss many of the unusual items that distort GAAP Earnings for Kimberly-Clark. Our proprietary process for adjusting financial filings corrects these inaccuracies and delivers a truer measure of earnings.
Figure 5: Comparing Kimberly-Clark’s GAAP, Street, and Core Earnings: TTM 3Q23
Sources: New Constructs, LLC and company filings.
Below, we detail the differences between Core Earnings and GAAP Earnings so readers can audit our research. We would be happy to reconcile our Core Earnings with Street Earnings but cannot because we do not have the details on how analysts calculate their Street Earnings.
Kimberly-Clark’s Earnings Distortion Score is Strong Beat and its Stock Rating is Attractive, in part due to its rising economic earnings, return on invested capital (ROIC) of 15%, and price-to-economic book value (PEBV) ratio of 1.0.
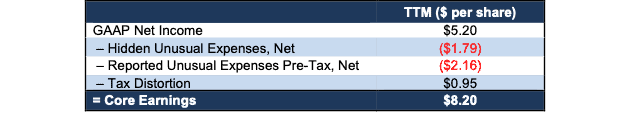
Figure 6 details the differences between Kimberly-Clark’s Core Earnings and GAAP Earnings.
Figure 6: Kimberly-Clark’s GAAP Earnings to Core Earnings Reconciliation: TTM 3Q23
Sources: New Constructs, LLC and company filings.
More details:
Total Earnings Distortion of -$3.00/share, which equals -$1.0 billion, is comprised of the following:
Hidden Unusual Expenses, Net = -$1.79/per share, which equals -$607 million and is comprised of:
- -$706 million in losses on asset dispositions, impairments, and divestitures in the TTM period based on
- -$663 million in asset impairments in 2Q23
- -$30 million in divestiture related costs in 2Q23
- -$11 million in asset impairments in 1Q23
- -$2 million in losses on asset dispositions in 1Q23
- $99 million in gains on previously held equity investment in 4Q22
Reported Unusual Expenses Pre-Tax, Net = -$2.16/per share, which equals -$732 million and is comprised of:
- -$658 million impairment of intangible assets in 2Q23
- -$96 million in other expense and non-operating expense in the TTM period based on
- -$35 million in other expense in 3Q23
- -$20 million in nonoperating expense in 3Q23
- $55 million in other income in 2Q23
- -$42 million in nonoperating expense in 2Q23
- -$15 million in other expense in 1Q23
- -$16 million in nonoperating expense in 1Q23
- $1 million in other income in 4Q22
- -$24 million in nonoperating expense in 4Q22
- $22 million contra adjustment for recurring pension costs. These recurring expenses are reported in non-recurring line items, so we add them back and exclude them from Earnings Distortion.
Tax Distortion = $0.95/per share, which equals $322.7 million
While higher than GAAP Earnings, Street Earnings still miss many of the unusual items in GAAP Earnings. The $1.60/share Street Distortion highlights that Core Earnings include a more comprehensive set of unusual items when calculating Kimberly-Clark’s true profitability.
This article was originally published on December 4, 2023.
Disclosure: David Trainer, Kyle Guske II, Italo Mendonça, and Hakan Salt receive no compensation to write about any specific stock, style, or theme.
Questions on this report or others? Join our Society of Intelligent Investors and connect with us directly.
[1] The Journal of Financial Economics features the superiority of our Core Earnings in Core Earnings: New Data & Evidence.
[2] Our Core Earnings research is based on the latest audited financial data, which is the calendar 3Q23 10-Q in most cases. Price data as of 11/14/23. QoQ analysis is based on the change since last quarter’s report.
[3] Average understated % is calculated as Street Distortion, which is the difference between Street Earnings and Core Earnings.