
Check out this week’s Danger Zone interview with Chuck Jaffe of Money Life.
GAAP earnings fail to provide the full picture of a company’s profitability. We’ve highlighted this fact in our report “The Earnings Recovery is a Sham”, and more recently in “The Earnings Recovery Remains an Illusion.”
The more investors understand about how GAAP net income omits valuable information, the better equipped they are to find truly hidden gems, or those companies with growing economic earnings and undervalued stock prices. Conversely, those relying solely on GAAP earnings are putting themselves at unnecessary risk.
Investors who take GAAP earnings at face value are in the Danger Zone this week.
GAAP Earnings Are Misleading
Our forensic accounting analysis of the latest 10-K and 10-Q filings for S&P 500 firms shows a growing divergence between GAAP earnings and economic earnings Through the first two quarters of 2017, GAAP earnings are up $61 billion from 2016 levels, while economic earnings have declined by $28 billion. Figure 1 shows this discrepancy extends well beyond the short-term.
Figure 1: GAAP Earnings Offer Misleading Trend in Profits
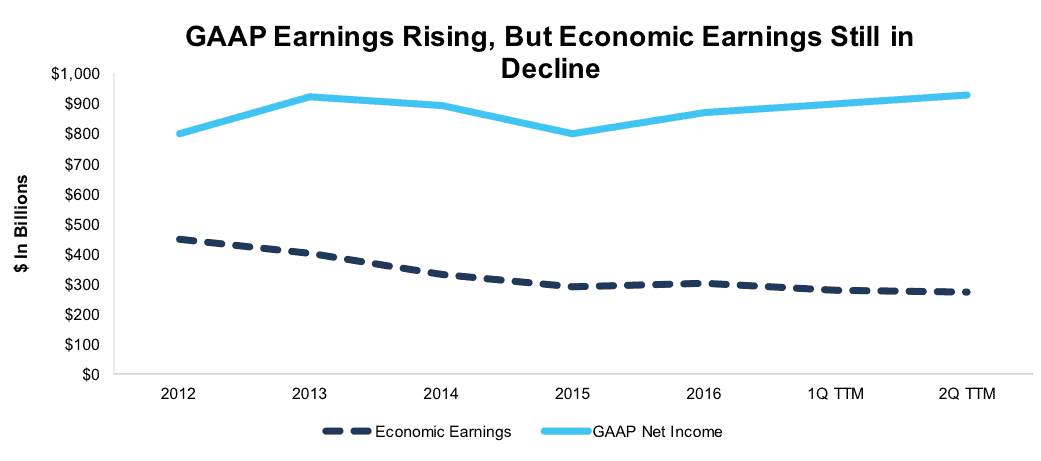
Sources: New Constructs, LLC and company filings.
Even more disconcerting is the fact that declining economic earnings have been accompanied by rising valuations in most cases. Figure 2 shows how the market capitalization of the S&P 500 has continued to rise even as economic book value, or the no growth value of firms, has declined.
Figure 2: Market Cap Rising, Economic Book Value Falling
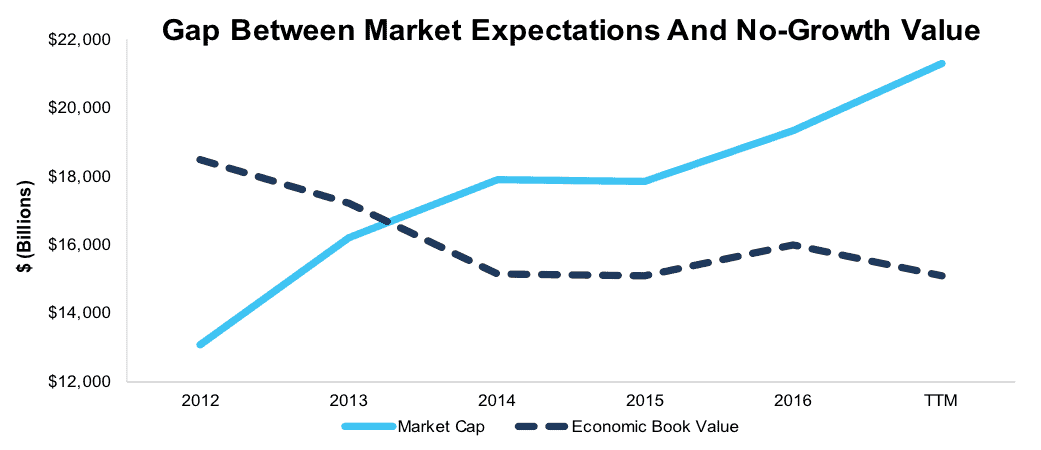
Sources: New Constructs, LLC and company filings.
Economic Earnings Tell the Whole Story
The disconnect between rising GAAP net income and falling economic earnings, and between market cap and economic book value, means investors must remain diligent to find true value. Investors should focus on economic earnings rather than GAAP earnings, which include non-operating items, are subject to manipulation, and don’t account for the cost of capital. Calculating economic earnings allows investors to see the true profitability of a company. Only then can one determine whether a stock is truly undervalued or overvalued.
Figure 3 lists the companies with the widest disparities between GAAP net income and economic earnings over the last twelve months.
FirstEnergy Corporation (FE) has the widest positive variance between GAAP net income and economic earnings in the S&P 500. The firm’s GAAP net income of -$5 billion is depressed by $11 billion related to asset write-downs. Asset write-downs are a form of shareholder equity destruction that is captured in our measure of invested capital. Asset write-downs also distort a company’s recurring, core profitability or NOPAT.
Figure 3: Largest Difference Between GAAP Net Income & Economic Earnings – TTM $ Basis
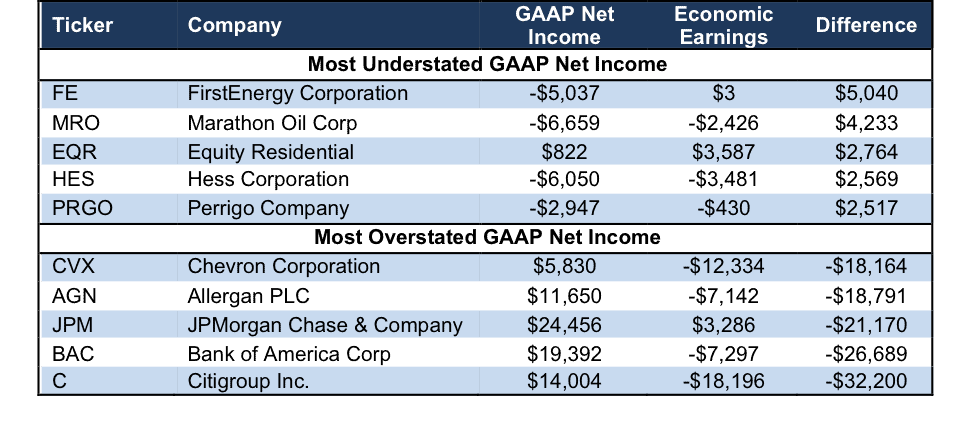
Sources: New Constructs, LLC and company filings.
Marathon Oil Corp (MRO), Equity Residential (EQR), Hess Corporation (HES), and Perrigo Company (PRGO) round out the top five firms where economic profitability is understated by GAAP earnings. However, a situation where economic profitability is understated by GAAP earnings does not necessarily warrant investment.
Marathon Oil and Hess Corporation each earn an Unattractive rating, in large part due to negative economic earnings and overvalued stock prices. On the other hand, First Energy earns an Attractive rating largely due to its positive economic earnings and low price to economic book (PEBV) ratio.
Citigroup Inc. (C) has the widest negative variance between GAAP net income and economic earnings in the S&P 500. Citigroup’s GAAP net income is $32 billion higher than its economic earnings. Bank of America (BAC), JPMorgan Chase (JPM, Allergan PLC (AGN) and Chevron Corporation (CVX) round out the top five firms where economic profitability is overstated by GAAP earnings.
Figure 4 shows the S&P 500 companies with the widest disparities between GAAP net income and economic earnings as a percent of revenue.
Figure 4: Largest Difference Between GAAP Net Income & Economic Earnings – TTM % of Revenue
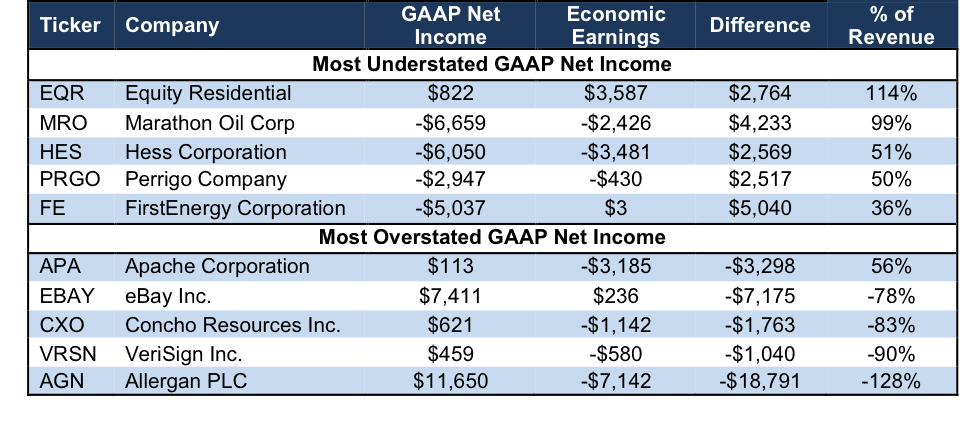
Sources: New Constructs, LLC and company filings.
Equity Residential (EQR) has the widest positive variance between GAAP net income and economic earnings as a percent of revenue. The $2.8 billion gap between GAAP and economic earnings is 114% of its TTM revenue. This understated economic profitability makes EQR look relatively expensive based on the traditional (and flawed) price-to-earnings (P/E) ratio. EQR’s current P/E ratio of 32 is higher than the average of 28 for 162 REITs under coverage. However, EQR’s price-to-economic book value (PEBV) ratio is only 0.3, which is well below the REIT average of 8.9.
Meanwhile, Allergan PLC (AGN) has the widest negative variance between GAAP net income and economic earnings as percent of revenue. VeriSign (VRSN), Concho Resources (CXO), eBay Inc. (EBAY), and Apache Corporation (APA) round out the top five firms where economic profitability is overstated by GAAP net income.
Remaining Diligent in An Overvalued Market
To avoid investing in stocks where GAAP earnings significantly overstate economic profitability, and inflate valuations as a result, investors should look for stocks that go against the current market trend of falling economic earnings and rising valuations. We recently featured one such stock as a diamond in the rough retail sector. Its consistent economic earnings growth stands out in a market filled with misleading metrics. There are still attractive stocks available for truly diligent value investors, you just have to dig below the surface.
This article originally published on September 18, 2017.
Disclosure: David Trainer, Kyle Guske II, and Kenneth James receive no compensation to write about any specific stock, sector, style, or theme.
Follow us on Twitter, Facebook, LinkedIn, and StockTwits for real-time alerts on all our research.
Click here to download a PDF of this report.
Photo Credit: Kate Ter Haar (Flickr)